* A Distributed Proofreaders Canada eBook *
This eBook is made available at no cost and with very few restrictions. These restrictions apply only if (1) you make a change in the eBook (other than alteration for different display devices), or (2) you are making commercial use of the eBook. If either of these conditions applies, please check with an FP administrator before proceeding.
This work is in the Canadian public domain, but may be under copyright in some countries. If you live outside Canada, check your country's copyright laws. If the book is under copyright in your country, do not download or redistribute this file.
Title: Weather, An Introductory Meteorology
Date of first publication: 1943
Author: Wilfrid George Kendrew
Date first posted: Sep. 15, 2018
Date last updated: Sep. 15, 2018
Faded Page eBook #20180925
This eBook was produced by: Stephen Hutcheson & the online Distributed Proofreaders Canada team at http://www.pgdpcanada.net
By
W. G. KENDREW
M.A.
OXFORD UNIVERSITY PRESS
NEW YORK 1943 TORONTO
Copyright 1943 by Oxford University Press, New York, Inc.
Printed in the United States of America
This book was written when the author was unable to consult various sources of information which he would have been glad to use, but it is hoped, in view of its elementary nature, that no very serious omissions or errors have resulted.
It has not been possible for him to correct, or even to see, the proofs, so he is the more indebted to the staff of the Clarendon Press who have shouldered this work and added yet another obligation to what is always due to their unfailing care and their interest in their authors’ work. He is also specially grateful to Miss E. E. Austin, who has been good enough to look over the proofs and make many important corrections. It is a privilege to have had the advantage of revision by such a competent authority. W. G. K.
The atmosphere and the weather which is its most visible expression are of interest to all, whether merely as a topic of passing conversation and a source of pleasure or disappointment at times of holiday, or, for many people, a serious concern which affects their lives and their livelihoods. Farmers are in this position, for even in a long-settled country like England a drought or a very rainy season is a disaster. And they are far more disastrous in such a region as the Middle West of the United States and Canada. For several years in the nineteen-thirties not only was the farmer ruined by a long and almost unbroken drought, but the land too suffered irreparably since the surface soil was whirled up as dust and carried away hundreds of miles. Weather has not less interest for all forms of transport. Road and even heavy railway transport are at the mercy of the rain-storm which may undermine or wash away the track, and of the snow-storm whose deepest drifts are invincible by snow-ploughs, and may hold up, or bury, trains for days. And the perils of the sea have been by no means abolished by the coming of steam.
No one engaged in travel and transport is more familiar with the meaning of weather than the air pilot, and he differs from the others in that though he passes most of his time like them at the bottom of the ocean of atmosphere, and has to take off in it and return through it to land, in addition he traverses it at all levels up to 20,000 feet and more. The scene of his weather has not only length and breadth, but also depth: a great advantage in many respects, but presenting difficulties too, for some levels may hold dangers. Rising above the 6 dullest sheet of grey cloud that enshrouds the earth below, the airman may come out into a boundless expanse of blue skies and sunshine. At times he looks both downward and upward through layer on layer of cloud, each with its own features of interest and beauty, and each level offering difficulties or aids for his journey. He must choose that in which the winds are most favourable, where such obstacles as turbulent clouds or thunderstorms or haze are least, and where bumpiness is not excessive. Generally he will have to balance advantage against drawback in choosing his level and course. It is here that the meteorologist—the weather expert—can help him, by providing him before taking-off with the information that has been collected or deduced about conditions aloft.
Little need be said here of the composition of the atmosphere. Most of the gases are so constant in the altitudes that can at present be visited that we are hardly conscious of them. But there are two in a different category. Oxygen, at not less than a certain pressure, is essential to life. But its pressure, like the pressure of all the other gases, decreases with altitude, and whether in an aeroplane or on a mountain-side we become painfully aware of the deficiency. Hence in ascents above about 15,000 feet an artificial supply is necessary, involving a burdensome but essential addition to equipment.
The other variable gas is water vapour, the source of cloud and precipitation. This is so important for many reasons at all levels that a later chapter (Chapter III) is devoted to it. The fundamental fact is that the atmosphere at higher levels holds less vapour than at lower, and clouds become less massive upward to the minimum in the delicate fibrous wisps of cirrus. An aeroplane flying very high and pouring its vapour-laden exhaust into the rarefied air often proclaims its track as a wide 7 trail of white cloud visible for an hour or more. The ribbon-like spirals and tangles add interest to the upper sky, but they have their drawbacks in time of war, for each is a pointer to the almost invisible machine which is producing it.
We derive our heat ultimately from the sun, which is always radiating into space the complex of energy called insolation. Not only is this the source of our heat, but indirectly also of the movements of the atmosphere, so that all our weather processes depend on it. The amount of solar energy that reaches the outside of the Earth’s atmosphere has been measured, and its value found to be about 1.94 calories per square centimetre per minute[1]; this is called the solar constant. But evidently the amount which is received on the actual surface of the Earth depends on several factors. The effect of the angle of incidence of the sun’s rays, which varies with latitude and season, can be calculated precisely without difficulty. The effect of their passage through the atmosphere is much more variable. Much of the insolation is reflected back into space, away from the Earth, by the clouds, and a certain amount is absorbed by the atmosphere itself with its suspended water and dust particles. (These effects cannot be calculated without far more elaborate observations throughout the thickness of the atmosphere than are available.) Finally, the remaining insolation reaches the surface of the Earth, and most of it is there absorbed. This heating of the surface is the point of immediate interest for us, for the air is heated not by the direct passage of the insolation, during which very little is absorbed, but by the surface, whether solid, liquid, or frozen, on which it rests, partly by conduction, partly by convection, and partly by the long-wave radiation sent back from the warmed surface.
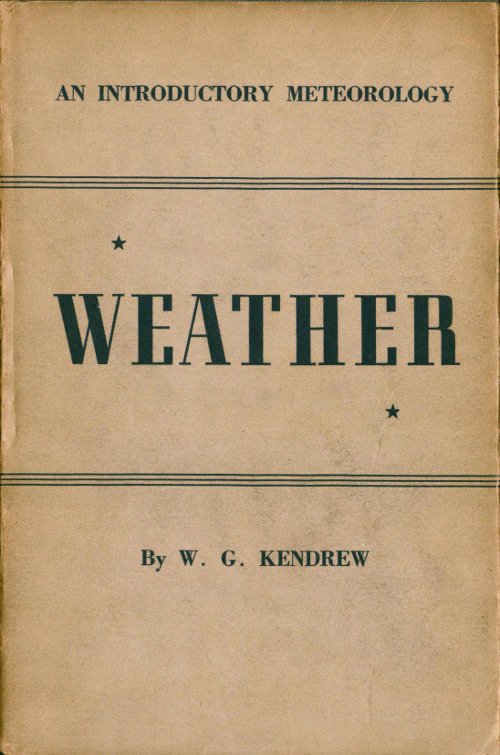
If we consider the mean annual temperature of the Earth as a whole, the belt neighbouring the Equator is warmest, and there is a general decrease towards the North and South Poles. But if we look more closely at small areas, and take winter and summer separately, we see how important the nature of the surface is. Land heats quickly and cools quickly, so that a land surface tends to have a high temperature in summer (and in the daytime) and a low temperature in winter (and at night). Water is very ‘conservative’, heating slowly but retaining its heat, so that it does not become so cold as land in winter. Snow and ice surfaces are extremely cold in winter, and even in summer they cannot rise above freezing point, and consequently give very cool summers. A study of the mean isotherms[2] in January and in July (Figs. 1 and 2) will provide examples of the facts mentioned.
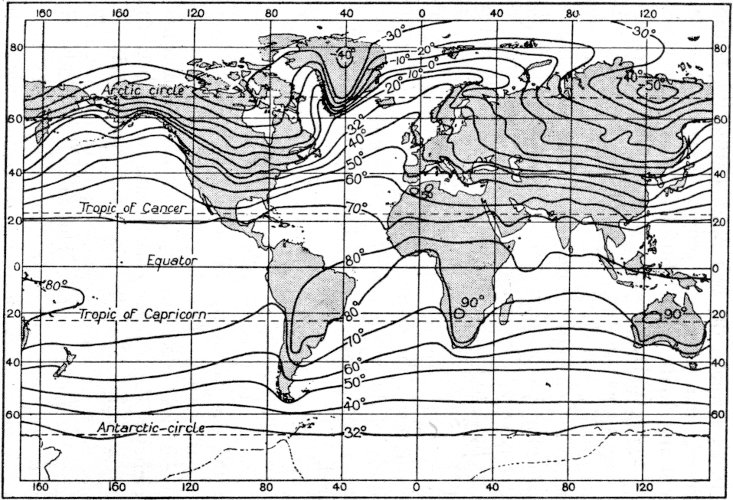
FIG. 1. JANUARY ISOTHERMS (°F.).
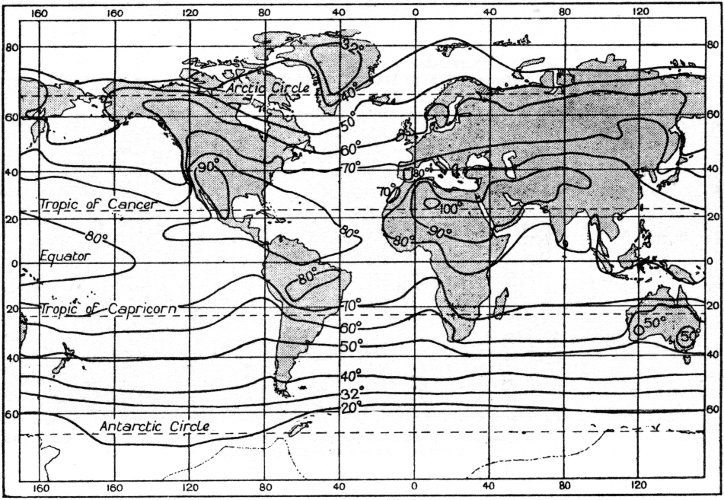
FIG. 2. JULY ISOTHERMS (°F.).

FIG. 3A. THERMOGRAM FOR THE WEEK 11-18 NOVEMBER, 1929 (RADCLIFFE OBSERVATORY, OXFORD).
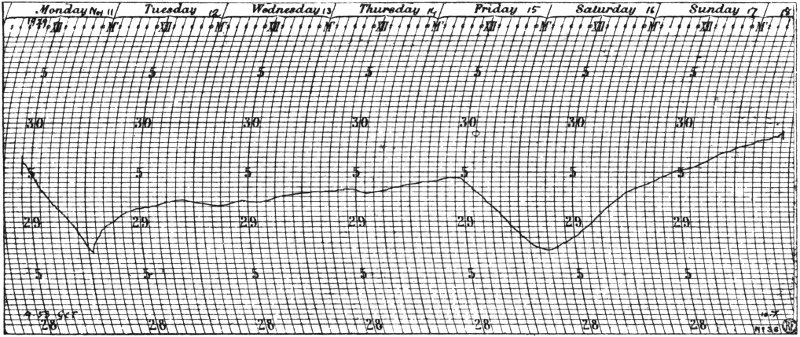
FIG. 3B. BAROGRAM FOR THE WEEK 11-18 NOVEMBER, 1929 (RADCLIFFE OBSERVATORY, OXFORD).
The atmosphere is a blanket which is more or less effective in checking the loss of heat from the surface of the Earth. Its effect is only slight when the air is clear and the sky cloudless, and nights with such conditions are usually cold. But the presence of dust and water particles, and especially thick low cloud, increases the efficiency of the blanket greatly, and the surface remains warm at night. The effect by day is the opposite. Clear sunny days are warm because more of the sun’s energy reaches the Earth’s surface than when it is cloudy. Hence a land area with clear air and cloudless sky has very warm summer days and very cool winter nights, but if the air is dusty and the sky cloudy the difference of temperature between day and night is much less. Personal observation will provide frequent examples. The influence of clear skies in winter shows itself most in the cold nights, for the nights are much longer than the days, but in summer it is the hot days which are noticeable. If the sun is hidden by cloud the temperature falls, but a clouding over at night raises the temperature if other factors remain constant. Continuous records of temperature, known as thermograms, provide daily examples of these effects, but other influences may be in operation, in particular the arrival of a new air mass. If cold polar air with clear skies replaces tropical air at night the fall in temperature may be very sharp; this happened on 12 November 1929, at 1 a.m. in the thermogram of Fig. 3A. An abnormal rise in temperature is seen in the same thermogram on 15 November, from noon to midnight, caused by the arrival of a warmer air mass with cloudy skies, which more than neutralized the usual fall in those hours. Frequently such weather and temperature changes are associated with rises and falls of the barometer, giving a tendency to a seesaw between the thermogram and the barogram (Fig. 3B). This is clearly marked on the days just referred to.
Most of the other constituents of the atmosphere are always present in about the same proportions at any one level, but the amount of water vapour and of the products of its condensation, droplets of water and particles of ice, is very variable, and hence is an important factor in weather. There is always some vapour, the atmosphere never being absolutely dry even in the driest desert, for the vapour is being picked up from every possible source—seas, lakes, rivers, icefields, vegetation—by the thirsty air, which is never satisfied till it is saturated. The original sources of the vapour are all on the surface of the Earth, and this is one reason why normally the lowest layers of the atmosphere contain most vapour.
There is a limit to the amount of water vapour which the air can absorb, the amount being greater the higher the temperature. When the limit at any particular temperature is reached, the air is said to be saturated. It cannot absorb any more, and, if the temperature falls, some of the water vapour will have to be got rid of, and will turn back or condense into water droplets.
It is useful to have the table (on p. 16) available for reference; it gives the weight of water vapour in grams which a cubic metre of the atmosphere can contain, when saturated, at different temperatures.
Two points stand out clearly; first the water vapour content is greater the higher the temperature, and secondly the rate of increase increases as the temperature rises. At 5° C. the content is 2.0 grams more than at 0°, but at 35° the content is 9.2 grams more than at 30°, the increase for a rise of 5° in temperature being over four 16 times greater in the hot than in the cold air. These facts have importance in many weather phenomena.
| WEIGHT OF WATER-VAPOUR IN A CUBIC METRE | ||
|---|---|---|
| °C. | °F. | grams |
| -5 | 23 | 3.2 |
| 0 | 32 | 4.8 |
| +5 | 41 | 6.8 |
| 10 | 50 | 9.3 |
| 15 | 59 | 12.7 |
| 20 | 68 | 17.1 |
| 25 | 77 | 22.8 |
| 30 | 86 | 30.0 |
| 35 | 95 | 39.2 |
While the atmosphere is picking up vapour it is also losing it in the forms of precipitation—rain, dew, etc.—so that it never all becomes wholly saturated. But clearly the parts of the atmosphere from which the precipitation comes have been saturated. This is most frequently caused by the cooling of air which is partly charged with vapour. Suppose that air at a temperature of 15° C. contains three-quarters of its possible vapour content, that is three-quarters of 12.7, about 9½, grams in a cubic metre, and then let it be cooled to 10° C.; the possible vapour content at 10° C. is 9.3 grams, and hence the air is now saturated. The ways in which cooling is brought about are considered in a later chapter.
The vapour content of the atmosphere is so important that it is necessary to understand clearly some technical terms used in connection with it. The absolute humidity means the actual amount of vapour present, and it may be expressed in several ways. The simplest is that used in the table above, namely the weight of the vapour in 17 a given volume of atmosphere. A more usual way is in terms of the vapour pressure; the whole atmospheric pressure as shown by an ordinary barometer is made up of the pressures of the separate components, and the pressure of the vapour may be singled out and expressed in millibars or inches or other unit used to indicate pressure.
Another common term is relative humidity, which means the percentage of the possible vapour content actually present. Thus if air at 30° C. contains 15 grams per cubic metre its relative humidity is 50%, since it contains half its possible content. Saturated air at 5° C. contains 6.8 grams per cubic metre, its relative humidity being 100%; however much it is heated the absolute humidity remains the same, but the relative humidity decreases rapidly with increasing temperature, since the possible vapour content of the warmed air becomes greater.
Consider now the effect of cooling air which is not saturated. Sooner or later a temperature is reached at which the vapour present is all that the air can hold, and this temperature is called the dew-point. If the cooling is continued below the dew-point the redundant vapour will be condensed to droplets of water in cloud or other forms. The condensation may be slow or fast, in small amount or large, a factor which determines the kind of rainfall. This is a point of much practical significance for the airman owing to its association with visibility and cloud conditions.
The drier the air the more vigorously does evaporation take place, and this fact is used in the instrument most frequently employed to determine humidity, namely the wet and dry bulb thermometers. Two ordinary mercury thermometers of the same form and size are exposed side by side, the bulb of one being covered with muslin which is kept wet by a wick dipping into a small 18 vessel of water. The evaporation from the muslin cools it, the degree of cooling depending on the rate of the evaporation which in its turn depends on the humidity of the air. Hence the difference between the readings of the two thermometers, considered in relation to the air temperature, gives a measure of the humidity; the necessary tables have been calculated for interpreting the readings, and they are in regular use. As an example, if the air temperature is 15° C. (59° F.) and the wet bulb reads 3° C. (5.4° F.) lower, the relative humidity is 68%.
Another common method depends on the fact that a strand of hair changes its length with the humidity. The ends of the strand being fixed the variation in its length can be made to control the movement of a pointer, the positions of which are graduated from the humidity readings of a wet and dry bulb thermometer. Frequent resetting is required, and this is a main drawback to the use of the instrument.
Before we leave this topic there is another physical process which must be mentioned. If water is heated to its boiling point, 100° C. (212° F.), it is not at once changed into vapour at the same temperature. To effect this change the expenditure of much additional energy in the form of heat is required, and this heat is sometimes termed the latent heat of evaporation. In the reverse process of changing vapour to water the same amount of energy is liberated in the form of heat as was previously expended. These processes are of very great importance in the atmosphere. If air is cooled below its dew-point the condensation of the vapour contained in it, as in the formation of cloud, liberates heat, and this is one of the great sources of energy in rising currents of air.
The pressure of the atmosphere is measured by barometers. The most accurate type is the mercury-barometer, in which a column of mercury adjusts its length automatically to balance the weight of a column of the atmosphere of equal section. The instrument is made in many patterns, among them the common barometer used in private houses. Good mercury barometers give readings of great precision, to an accuracy of 0.1 millibar (mb.) (or 0.003 of an inch).
A more portable and convenient, but less accurate, barometer is the aneroid, in which the differences of pressure are indicated by the relative movements of the faces of an airtight metal capsule almost exhausted of air. Though less accurate than the mercury barometer the aneroid has the great advantage that it can easily be adapted to give a continuous record of the pressure in the form of a line traced by a pen on a chart, which is clipped to a drum revolving by clockwork. Such an instrument is called a barograph. Most meteorological stations have both a barograph and a mercury barometer.
Formerly the atmospheric pressure was expressed in terms of the length in inches, or millimetres, of the column of mercury in the barometer, which, however, had to be corrected to its equivalent for mercury at a temperature of 32° F., and standard gravity, i.e. the gravity at lat. 45°. But it is now the practice to have the scale graduated to show-millibars, the millibar being the unit of pressure in the C.G.S. system. C.G.S. is the abbreviation for centimetre, gram, second. In the C.G.S. system of units lengths are measured in centimetres, mass in grams, and time in seconds. One millibar is approximately the pressure exerted by a layer of water 1 cm. deep, and 1000 mb. is the pressure of a column of mercury 29.531 inches long, at 0° C. and gravity of lat. 45°. It is clearly more appropriate to express pressure by the unit of pressure rather than by a unit of length, the inch, and for most meteorological purposes the millibar has great advantages. Inches can easily be converted into millibars by the use of tables.
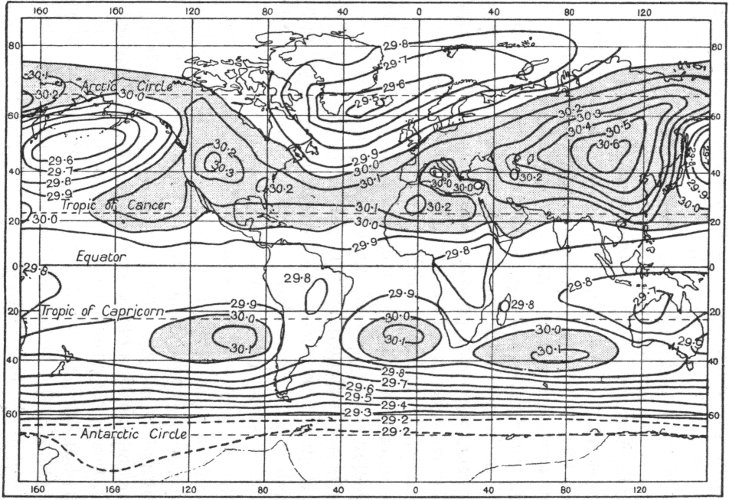
FIG. 4. JANUARY ISOBARS. (INCHES.)
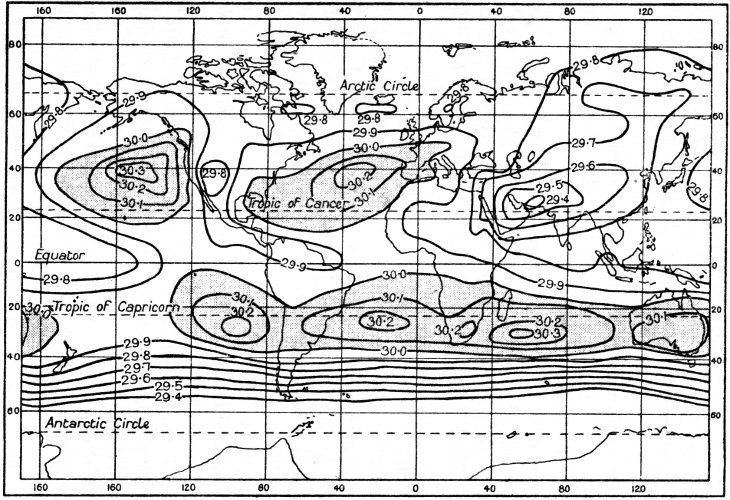
FIG. 5. JULY ISOBARS. (INCHES.)
Barometric pressure is always changing, more or less rapidly, all the world over, and the changes give a valuable clue to the weather processes. If the pressure is read daily at a meteorological station for a long series of years, 30 or more, the mean for that station can be established. The means vary in different parts of the world and in different seasons. They can be conveniently mapped in the form of isobars,[3] and charts of the mean pressure in January and in July are given in Figs. 4 and 5. In general, pressure is highest in the sub-tropics, centring about 30° to 35° N. and S. latitude, and these areas of high pressure are known as the sub-tropical anticyclones. It is considerably less in the equatorial zone. On the poleward sides of the sub-tropics it falls to a minimum about 60° N. and S. latitude, and then rises a little in the polar regions. However, the arrangement is not quite so simple owing to the juxtaposition of continents and oceans, which causes strong temperature contrasts along any parallel of latitude, and the pressure depends in part on them. Although the pressure at any time may differ widely from the mean, yet the means are a necessary standard for the interpretation of the actual readings. The great pressure systems themselves are of practical 23 significance in at least two ways. Firstly, each of them has its type of weather, the high pressure systems having light winds and generally fair weather, the low pressure systems strong winds and cloudy and rainy weather; the North Atlantic anticyclone centred south of the Azores is an example of the former, the Icelandic low pressure system south of Iceland illustrates the latter. And secondly, the pressure systems are the basis of the great wind systems (Figs. 6 and 7), which exert a dominant control on climate.
Space does not admit of any adequate description of the great wind systems. Their study is itself the subject of meteorology. But attention may be drawn to a fundamental distinction illustrated by the two most prominent, the Trades and the Westerlies. The Trades are the winds that blow on the east and the equatorward sides of the sub-tropical anticyclones, between about 30° and 10° N. and S. latitudes. Their mean direction is from NE. in the north hemisphere, SE. in the south. They sweep over enormous areas, larger than our charts suggest, since their region is where the meridians on the globe are drawing farthest apart in low latitudes. They are ‘constant’ winds, that is, so steady in direction and force that the mean gives a good approximation to the winds likely to be found on any day. But there is no absolute constancy. Variations in direction and force, occasionally large variations, do sometimes occur, as well as variations in the extent of the area over which they blow. But nevertheless they are a very picture of regularity by comparison with the Westerlies. The surface Trades seem to be fed for the most part by air descending from the higher atmosphere in the sub-tropical high pressure systems derived originally from the ascending currents of the equatorial belt. The descent warms the air, and dries it, a result being the remarkably small amount of cloud over the sub-tropical continents in winter. Over the oceans, however, there is much low cloud formed in the damp air below the base of the vigorously descending currents. An appreciable contribution to the air supply of the Trades is made by polar currents which sometimes make their way through the sub-tropics in the east of the oceans in rear of depressions of the Westerlies. These latter are the wind systems between the sub-tropical anticyclones and the low-pressure systems centred about 60° N. and S. latitudes. They are essentially variable or ‘prevailing’ winds. Their region is the scene of the travelling pressure systems which are so well known in the British Isles, and since these are extremely variable in form, intensity and position, the winds which they control are likewise variable in direction and force. Every direction is to be expected, and the force varies from 0 to 12 of the Beaufort Scale (see p. 36), though the extreme values are rare. In much of the region there is really no pronounced dominant direction.
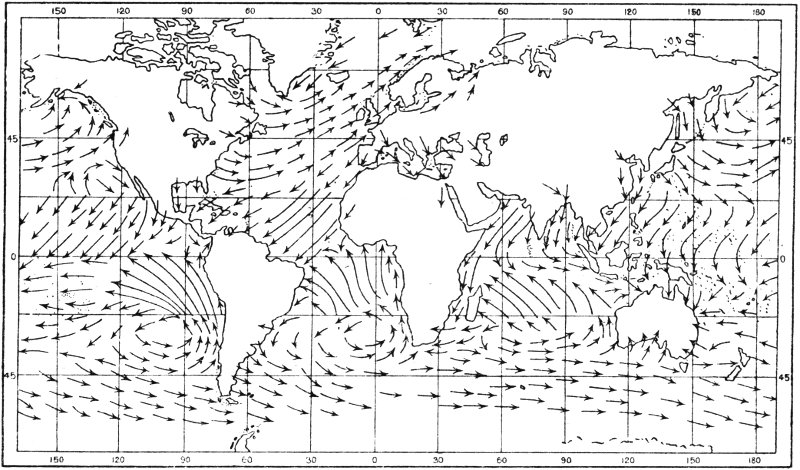
FIG. 6. WINDS IN JANUARY.
The length of the arrow indicates the constancy of the winds.
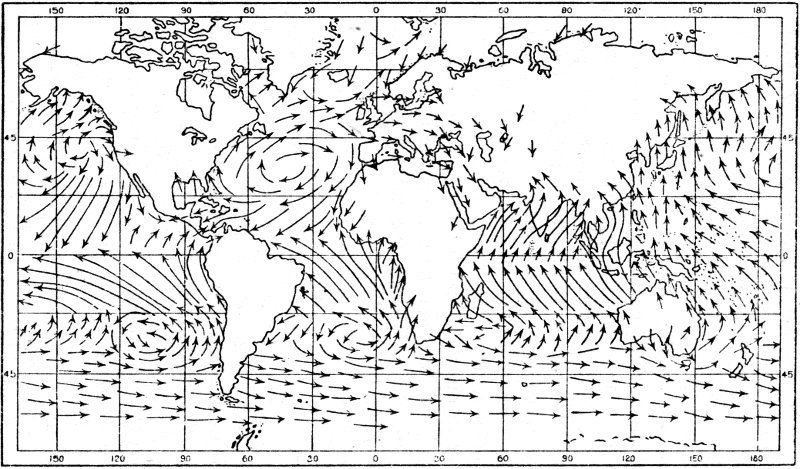
FIG. 7. WINDS IN JULY.
The distinction that has been pointed out here between constant and prevailing winds is fundamental. The constancy of the Trades indicates that the true Trade Wind regions are almost devoid of cyclonic disturbances, while the variability of the Westerlies is due to a complex of irregular pressure systems.
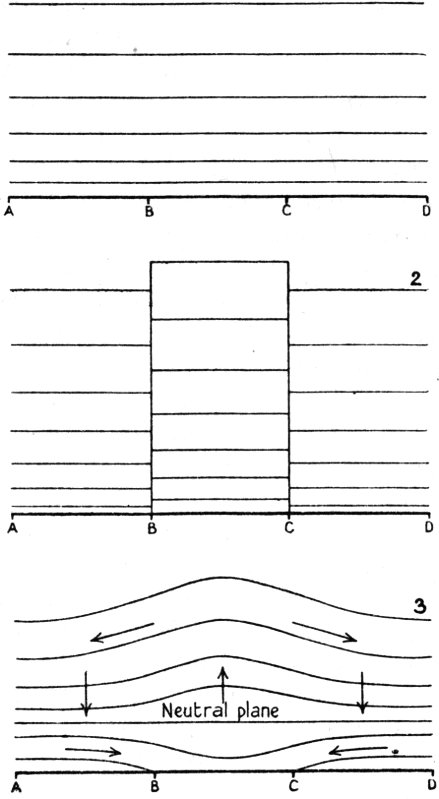
FIG. 8. EFFECT OF HEATING ON PRESSURE IN THE ATMOSPHERE.
The fundamental cause of the differences in pressure is differences in heating. Fig. 8 (1) represents a section of the atmosphere; the temperature is everywhere the same at any level, and the air is at rest. In Fig. 8 (2) the base of the column of air above B C is warmed, the column being regarded as separated by airtight walls from the surrounding air. The heated air expands, and being unable to move sideways it rises. In spite of the heating there can be no change in the pressure on B C since all the air that was in the column before it was heated is still present. Next let the enclosing walls be removed. The air on the top of the heated column at once flows outward, and a difference in pressure between B C and A B and C D is set up, since air is removed above B C and added outside. As soon as this happens the air near the ground will flow from A B and C D towards B C (Fig. 8 (3)). Thus the outflowing currents aloft bring about a decrease of pressure near the ground above B C and an increase on each side. The wind blows inward at the lower levels toward the heated, 28 low-pressure area, and there are rising currents above B C to feed the outflow above, and descending currents above A B and C D to feed the surface winds. If the supply of heat to B C is continued the circulation will be maintained. A good example of such a system may be seen on islands in the warmer parts of the Earth, the island being much warmer than the surrounding ocean by day, and breezes blowing into it from the sea (‘sea-breezes’). At night the island is the cooler, and the circulation is reversed, giving ‘land-breezes’. In tropical Asia, and to a less degree in other continents, the heating of the lands in summer and the cooling in winter give rise to a seasonal rhythm with ‘monsoon winds.’
The general circulation of the atmosphere as a whole is to be traced ultimately to the greater heating of the equatorial zone. But a glance at charts of pressure distribution shows that many of the features are not the immediate result of differential heating, and in particular most of the temporary irregularities of pressure which are prominent in the Westerlies seem to require some other explanation, though even in them the thermal effect which has been described is present and must be allowed for in any analysis. But it is easily shown by records of temperature and pressure that depressions do not necessarily develop in areas of surface warmth nor anticyclones in areas of surface cold.
The pressure of the atmosphere above us is reduced if we rise from the surface of the Earth, as in an aeroplane. If the pressure at the surface is 1,013 mb., and the temperature of the air 59° F., then under normal conditions the pressure will be:
| 900 mb. | at about | 3,250 ft. |
| 800 mb. | ” | 6,500 ft. |
| 700 mb. | ” | 10,000 ft. |
| 600 mb. | ” | 14,000 ft. |
| 500 mb. | ” | 18,250 ft. |
Thus at about 18,000 ft. the pressure is half that at sea level; the decrease is most rapid in the lowest, densest layers. Advantage is taken of this to construct instruments, altimeters, to show the elevation of aeroplanes above sea level. The ordinary barometer is their basis, for the essential requirement is a knowledge of the pressure at the elevation in question, and an aneroid is the form of barometer commonly used. But it is difficult to obtain accurate readings of the height, partly owing to the inherent inaccuracy of the aneroid, partly because the pressure at any level depends on the pressure at sea level vertically below, and also on the mean temperature of the column of air between the aeroplane and sea level, and these values are constantly varying, so that if the altimeter is set to read correctly in the conditions prevailing when the aeroplane takes off, there may be a large error, amounting to hundreds of feet, when it is used later. The largest factor that causes error is the changing pressure at the surface, and after a long flight pilots often ask for surface pressure by wireless so that they may reset their instruments. It is obviously very important for a pilot to know his exact height, especially in thick weather. A fall in pressure of 10 mb., or 0.3 of an inch, at the surface since the flight started, whether due to a general fall in pressure or to the fact that pressure is lower in the new locality than at the starting point, would cause the reading of the altimeter to be almost 300 ft. too high.
All air-borne machines are at the mercy of the wind. The actual speed and direction of an aeroplane over the surface of the Earth is the resultant of the movement of the machine in still air and that of the atmosphere in which it is flying. Its own movement, or air speed, is known. The problem in air navigation is to allow for the movement of the atmosphere. This is measured at the aerodrome, and the pilot knows it before taking off. But the wind will probably change during his flight, owing to the lapse of time and the change of position and elevation of the aeroplane, and if no further information is available from the ground beneath, the pilot must rely on his own observations to find out the conditions, which is not difficult when the visibility is good so that the ground can be seen.
By ‘wind’ is commonly meant the horizontal movement of the air. There are also vertical movements, sometimes of a dangerous velocity for aircraft, which will be considered in a later chapter. We have already seen in Chapter IV one way in which differences of atmospheric pressure can arise. Winds are the horizontal air currents set in motion from the higher to the lower pressures, which they tend to equalize. Isobars show by their distance apart the rate of change of pressure; the closer they are the steeper the pressure gradient. They may be compared with the contour lines of a topographical map which show the slope, or gradient, of the ground. The closer the isobars the steeper the gradient and the stronger the wind.
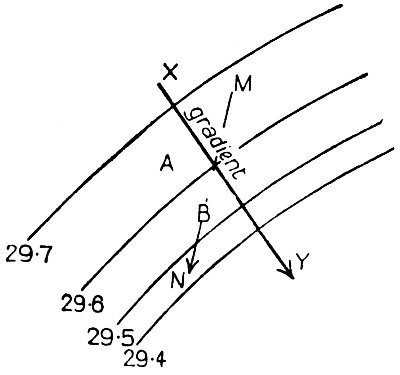
FIG. 9. ROTATIONAL DEFLECTION.
Another consideration must now be introduced, rotational deflection. The rotation of the Earth causes all moving bodies to be gradually deflected towards the right (of the direction in which they are moving) in the northern hemisphere and towards the left in the southern. The deflecting force increases both with the speed of the moving body and with increasing distance from the Equator. At the Equator there is no deflection; the force increases to a maximum at the Poles. In Fig. 9 the arrow X Y, drawn normal to the isobars from the higher to the lower pressure, shows the direction of the gradient; the gradient is steeper at B than at A, and consequently the wind is stronger. In the northern hemisphere the moving air is deflected towards the right, and the surface wind may be indicated by the arrow M N, but its actual direction depends on several factors. If there is no friction the moving air continues to be deflected until it moves along the isobars instead of at right angles to them, and its speed will be such that the deflecting force exactly balances the pressure gradient. Such a wind is known as the geostrophic wind and in practice it is found at a height of about 1,500 ft. Below this level, friction on the surface of the Earth is more and more in evidence, and the effect is to diminish the speed of the wind and hence to cause it to blow at an angle to the isobars from 32 high pressure to low. Friction is least on the sea, greater over flat bare ground, and still greater over forests and towns. At sea the surface wind is about two-thirds of the geostrophic, and it is deflected from the isobars about 15° toward the lower pressure. On land the wind is only about one-third of the geostrophic, and the deflection from the isobar is about 30°. The exact relationship varies, however, with circumstances. A scale graduated to measure the geostrophic winds appropriate to the pressure gradients found on synoptic charts is commonly used by those who have to interpret such charts. If the isobars are much curved the effect of centrifugal force becomes appreciable and must be allowed for in the calculation; when such allowance is made the wind so obtained is known as the gradient wind.
Above 1,500 ft. the pressure distribution may be considerably different from that at the surface, so that the surface isobars no longer apply. Aeroplanes however frequently fly at much greater heights than 1,500 ft., and a knowledge of the winds there is desirable. The ordinary method of observation is by pilot balloons. These are rubber balloons, commonly 90 in. in circumference; filled with hydrogen so that they rise at a constant rate. Their direction is observed at the end of each minute after release by means of a theodolite (an instrument for determining horizontal bearings and elevations accurately), so that, since the height is known from the rate of ascent, the position can be readily calculated, and the movement at any desired level obtained. In good conditions ascents of over 10,000 ft. are easily observed, and not infrequently 30,000 ft. is attained. The balloon cannot be observed after it enters cloud, so that on days with much low cloud these observations are restricted. But the movement of the clouds can be observed and gives useful information if the height of the clouds is known. The clouds rarely move in the direction of the 33 surface wind. In the northern hemisphere, low clouds almost always come from a direction two or three points to the right of the surface wind, for they are floating in the gradient wind.
If a record is kept of the speed and direction of the surface wind hour by hour, it will be seen that often there is a relationship between them and the time of day. At night the air is usually calm or its movement is slight, and after sunrise the speed increases till afternoon when it is at a maximum; during this time the direction has veered somewhat,[4] but this is hardly perceptible on most days. In the late afternoon the speed usually begins to drop, and the wind backs, to fall to a minimum in the night. These facts have a simple explanation. At night a layer of cold air forms on the ground, and its density is such that it may be quite stagnant, while the air aloft continues to blow over it. After sunrise the ground is heated and soon rising currents of air are set up, effecting an interchange between the still air below and the rapidly moving air above, so that the calm of the night is dissipated. The surface wind blows stronger as the heating continues, and falls away again with the cool of the evening. The effect tends to be greatest where the diurnal range of temperature is greatest. It is less when the general wind is very strong, since the surface air is then churned up even at night, and no stagnant layer can form. The basis of the diurnal change in the surface wind, then, is the fact that the wind is stronger aloft. If, as may occasionally happen in an anticyclone, it is calm aloft there will be no wind on the surface even during the heat of the day.
Various instruments have been devised to record the speed and direction of the wind. As with the other 34 elements of weather a continuous record is preferable to momentary readings. The instrument now in use at most stations is the Pressure-Tube Anemometer, which gives a continuous record of both speed and direction. Its essential feature is a horizontal tube about 1 in. in diameter arranged so that by means of a large wind-vane its open end is kept pointing into the wind, which increases the pressure in the tube according to its speed. This horizontal tube is free to rotate round a long vertical tube, to which it is attached by an air-tight joint, so that the changes of pressure are communicated through it. Another similar vertical tube (commonly arranged to surround the first) has a number of holes drilled through it near the top, just below the horizontal tube which faces the wind; when the wind blows past there is a suction effect in the tube. These two tubes, with the wind-vane attached to the first, form the head of the anemometer, which is firmly fixed in a well-exposed position at 30 ft. to 50 ft. above the ground. The pressure differences in the head are transmitted through pipes to the recording apparatus which is kept in a convenient position in a building below. The recorder is a hollow metal vessel of rather complicated design, which floats in a closed chamber about two-thirds full of water. The interior of the float is a cylindrical space, open below and closed above, in which the water rises about three-quarters of the length, the upper quarter containing air (there is another air tank, permanently air-tight, round the outside of the float to keep it buoyant). The lower end of the pressure tube enters the bottom of the chamber and opens into the air space at the head of the float. The suction pipe ends in the air space of the chamber. When the wind blows there is an increase of pressure in the air-containing head of the float, and a decrease in the air space in the chamber, and consequently the float moves upward as the wind increases. The top of the float has a 35 rod attached to it which passes through the top of the chamber, and its up and down movements are recorded by a pen which it carries, with its point resting on a chart clipped on a drum revolving by clockwork. It will be remembered that the pressure-head is kept pointing directly into the wind by a wind-vane; the changes in its direction also are recorded by a suitable mechanism on the same chart. The whole anemometer is heavy, bulky, and rather complicated, but it serves its purpose well, and its records have provided much valuable information on the nature of wind.
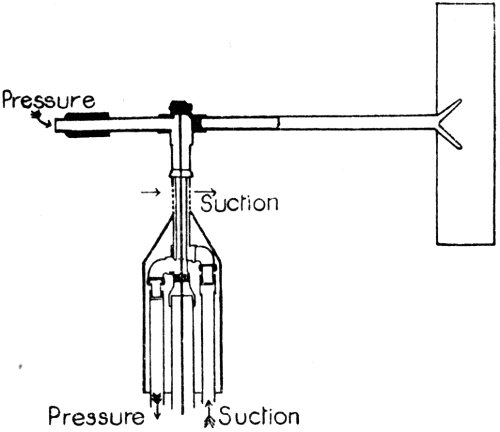
FIG. 9A. HEAD OF THE PRESSURE TUBE ANEMOMETER.
The wind is never perfectly steady in speed or direction, but consists of a series of gusts and squalls which are largely caused by the obstructions on the ground described in connection with turbulence in Chapter VIII. Even when the wind feels steady the record of the anemometer is far from being a straight line, but is a ribbon with the gusts and lulls marked above and below the mean. The width of the ribbon is an indication of the degree of gustiness. The gustiness is much greater on 36 land than at sea, and it is usually greater with strong winds than light. The gustiness decreases in the higher levels above the turbulence caused by the irregularities on the surface. These records, not only of the mean force and direction of the wind but also of the means of the gusts and lulls and the extremes reached, are all of great practical use for air navigation as well as being of scientific interest.
| THE BEAUFORT SCALE OF WIND FORCE | |||
|---|---|---|---|
| Beaufort Number | Description of Wind | Limits of Velocity (in m.p.h.) at 30 ft. above ground | Specification for use on Land |
| 0 | Calm | less than 1 | Smoke rises vertically. |
| 1 | Light Air | 1-3 | Direction shown by smoke, but not by wind-vanes. |
| 2 | Light Breeze | 4-7 | Wind felt on face; leaves rustle; ordinary vane moved by wind. |
| 3 | Gentle Breeze | 8-12 | Leaves and small twigs in constant motion; wind extends light flag. |
| 4 | Moderate Breeze | 13-18 | Raises dust and loose paper; small branches are moved. |
| 5 | Fresh Breeze | 19-24 | Small trees in leaf begin to sway. |
| 6 | Strong Breeze | 25-31 | Large branches in motion; umbrellas used with difficulty. |
| 7 | Moderate Gale | 32-38 | Whole trees in motion; inconvenience felt when walking against wind. |
| 8 | Fresh Gale | 39-46 | Breaks twigs off trees; generally impedes progress. |
| 9 | Strong Gale | 47-54 | Slight structural damage; chimney pots and slates removed. |
| 10 | Whole Gale | 55-63 | Trees uprooted; considerable structural damage. |
| 11 | Storm | 64-75 | Widespread damage; very rarely experienced. |
| 12 | Hurricane | Above 75 | |
Without any instrument it is possible to give a useful 37 estimate of the velocity of the wind on the Beaufort Scale, devised by Admiral Beaufort more than 100 years ago. In it a dead calm is denoted by 0 and the strongest wind in a hurricane by 12, and a specification has been worked out for the numbers on the scale depending on the visible effect of the wind on the surface of the sea, and, for shore use, on the twigs and branches of trees, flags, etc. This scale is universally used, and all meteorologists should remember it.
The horizontal movements of the air are obvious enough, and their effects are sometimes only too evident. The vertical movements, which are almost always present, pass unnoticed by most people, except when they are specially vigorous. In the tornadoes of the United States even such heavy articles as chairs and animals may be swept from the ground and whirled up hundreds of feet. The airman at any rate is conscious of the vertical movements, which he experiences as ‘bumps’. The variations in the number and severity of bumps show that the vertical air movements are variable like the horizontal winds. The movement is visible from below in the forms of cumulus clouds swelling upward.
If the wind meets a mountain range it is forced upward, and the ascent may continue to a much greater height than the top of the range. In this case the barrier which forces the air upward is solid and visible. A similar effect is produced when a mass of air meets another mass of air denser than itself, and has to rise to surmount it. And cold dense air may advance against a warmer air mass which it undercuts and forces upward. These movements are prominent in the low-pressure systems of the Westerlies which will be described in Chapter XIII.
Turbulence (Chapter VIII) evidently involves upward and downward movements in the whirls of which it consists. The height to which the turbulent movements extend depends largely on the temperature conditions, but it often exceeds 6,000 ft.
A very frequent and easily understood cause of vertical movement is the heating of the surface on which the air rests, so that convection currents are set up. They may be seen in the shimmering over hot, bare soil under the heat of the morning sun. Pilots recognize the rising currents by the bumps to which their machines are subjected. The passage from a water to a land surface on a hot sunny day may be as obvious in the air hundreds of feet above as on the surface, for the ascending current over the land causes a sharp bump when the machine enters it from the air over the cool water, which is descending slightly. The boundary of the rising column continues to be sharply marked to a height of some thousands of feet. Bumps are sometimes felt even high above the junction of grassland and bare soil.
If the rising air contains much vapour this may condense into cloud at a certain level, the clouds being of a cumulus (‘cauliflower’) form. They may tower up to 20,000 ft. or 30,000 ft., and the upward movement in them often reaches 20 miles an hour, and sometimes much more. These violent uprushes are always uncomfortable, and may be dangerous even for heavy aircraft, which will normally avoid them when possible. But the less violent upward currents, associated for instance with the comparatively peaceful cumulus clouds of fine summer afternoons, are used regularly by glider pilots, who acquire by experience great skill in detecting where suitable thermals, as the rising currents are called, can be found to enable them to rise. The record altitude for a glider in this country of over 14,000 ft. was attained on an early summer afternoon near Dunstable. The pilot made his way to a massive cumulus cloud which he entered near the base, and was lost to view. Inside the cloud he found extremely disturbed conditions, and was carried up at great speed, in no small danger from the turbulent whirls of thick cloud in which all sense of 40 direction and level was lost. After a perilous ascent he managed to emerge safely near the top of the cloud.
There must be downward movements to compensate the upward, but though these are at times vigorous they are usually spread over a wider area and are less rapid.
Vertical movements, on a large scale in respect of area, but usually of much too small velocity to be directly perceived, are associated with high-pressure and low-pressure systems, as was seen in Chapter IV. Their importance lies in their effect on the humidity conditions, in determining the presence or absence of cloud and fog. They are also a factor in causing smoke and other solid impurities to remain in the surface layers, where they collect in more and more abundance and obscure the air, or to rise with the rising air and become scattered through a large expanse of atmosphere, where they are so tenuous as to be negligible. This is a matter of great importance in the use of gas and of smoke-screens in war, for unless the gas or the smoke remains on the surface it is of little use. If there are upward currents the gas or smoke is carried away into the higher layers of the atmosphere. Hence they are not effective on sunny afternoons on land, nor yet in a wind with vigorous turbulence. But if the surface air is cold, and has only enough horizontal drift to bring the gas or smoke to its objective without much turbulence being set up, the required results are attained.
The previous chapter described vertical movements of the atmosphere from the point of view of their mechanical effect on aeroplanes, poison gas, and the like. We must now consider them in another connection, with regard to the changes of temperature which they cause. The physical principle is simple. When air expands some of the energy it contains in the form of heat is used to effect the outward motion of the molecules required to fill the larger volume, with the result that the temperature of the air falls, and for a similar reason contracting air becomes warmer. This heating due to change of volume without any addition of heat from outside is called adiabatic heating. The principle is constantly in operation in the atmosphere, for as air rises it expands owing to the decreasing pressure, and as it sinks it contracts. The rate of rising or sinking does not matter except that if it is very slow the adiabatic change of temperature may be neutralized or even reversed by other influences in operation, such as radiation. The rate of adiabatic change is 1° C. for 100 m. of change of altitude (or 5.4° F. for 1,000 ft.) throughout the depth of the atmosphere with which we are concerned, which means that whenever air changes its height by 100 m. its temperature falls or rises 1° C., no matter what the cause of the change in height may be. This rate of change of temperature in dry air is called the dry adiabatic lapse rate.
It was pointed out in Chapter III that all air contains vapour, and this vapour is condensed into water when the air is cooled to its dew-point. The adiabatic cooling 42 of rising air will bring most air to its dew-point within a few thousand feet. The condensation of vapour is accompanied by the liberation of latent heat. Hence if saturated air rises there are two opposed thermal changes going on in it; it is being cooled adiabatically by its expansion, and it is being warmed by the liberation of latent heat in the condensation of its water vapour. We have seen that the former process causes a constant fall of temperature with decrease of height, at the dry adiabatic lapse rate. The warming effect of the liberation of latent heat depends on the amount of vapour condensed, being large when there is a large store of vapour, that is when the saturated air is at a high temperature, and decreasing as the store of vapour decreases, i.e. as the temperature falls. In the case of air at the average temperature of temperate regions the addition of heat is about 0.5° C. for 100 m. of ascent (or 2.7° F. for 1,000 ft.), which is half the dry adiabatic lapse rate, so that the net decrease of temperature in the rising air, called the saturated adiabatic lapse rate, is 0.5° C. for 100 m., or 2.7° F. for 1,000 ft., this being the difference between the heat lost and heat gained. At the top of the troposphere (see p. 48) the air is so cold that the latent heat of condensation of the very small amount of vapour present is negligible, and the saturated adiabatic lapse rate is almost the same as the dry.
The condensation of vapour in the atmosphere is shown by the appearance of cloud. Hence the adiabatic cooling in a rising current which contains cloud is much slower than in one which is still cloudless. When air descends its increasing heat soon evaporates any cloud it may contain. This tendency for rising currents to be cloudy and descending currents clear is one of many reasons for the importance of vertical movements in meteorology.
The next point for consideration is whether the 43 surface air at any given time will rise or not, and if it will rise, the height it will reach, and the cloud conditions to be expected in it. The answer depends mainly on two factors, the temperature of the surface air itself, and the temperature of the atmosphere above it, or the ‘environment’. The atmosphere is always being churned up by horizontal and vertical currents, and it is known from very many soundings that in the troposphere the mean temperature becomes less with increasing altitude. The mean rate of fall in temperature is about 0.6° C. for 100 m., or 1° F. for 300 ft., throughout the troposphere all the world over, but no one sounding will show this rate all the way up from the surface, and large variations occur, especially in the lowest 10,000 ft. It is part of the daily routine of a meteorological service to obtain soundings of temperature and humidity from the ground up to as great a height as possible, usually 20,000 ft. at least. The soundings can be conveniently shown, as in Fig. 10, which is similar to the diagram in the Upper Air Supplement of the British Daily Weather Report. In it there are three sets of lines in addition to the rectangular grid which shows temperature and altitude. A B C, A₁ B₁ C₁ and A₁₁ B₁₁ C₁₁ show the adiabatic lapse rate in rising air, A B, A₁ B₁ and A₁₁ B₁₁ for the air while it is still unsaturated, B C, B₁ C₁ and B₁₁ C₁₁ for the same air after it has cooled below its saturation temperature which is at B, B₁ and B₁₁; the three lines are inserted, instead of one only, merely for convenience in tracing the temperature changes from different surface temperatures. The next set of lines includes the two marked February and August, which give the mean lapse rates in those months, and the two marked 2 Oct. 1908 and 5 Apr. 1911, the extremes of cold and heat that have been recorded in the south of England. The remaining two show actual soundings at Duxford. Cambridgeshire, on two consecutive mornings which are 44 referred to in Chapter XIV; they differ considerably from the means, especially in the lower levels, and they are typical of the usual soundings met with.
Air is said to be stable if it tends to remain at its own level, unstable if it tends to rise owing to its buoyancy and take the place of air above it. The surface air in the early morning after a calm cloudless night is cold, often as cold as the air at higher levels, and sometimes much colder. This condition is called an inversion of temperature (see p. 46). Clearly the surface air has no tendency to rise, for both its greater pressure and its lower temperature cause its density to be greater than that of the air above. As the day draws on the sunshine rapidly warms the surface and the air resting on it, but the higher atmosphere is hardly affected and its temperature remains little above what was found in the early morning. Soon the surface air is warm enough to be less dense than the surrounding air; it becomes buoyant and starts to rise, for its former stability has turned to instability. Immediately it rises it cools at the dry adiabatic lapse rate, and at 1,000 ft. it is 5.4° F. cooler than before. If, in spite of this cooling, it is still warmer than its environment, that is the surrounding air at the same level, it continues to rise; our knowledge obtained from the morning sounding will indicate if this is the case. Usually the ascent will not continue very far for dry air, since dry air cools rapidly as it rises, and it will soon be at the same temperature as the environment, when it can rise no farther. Only if there is an unusually steep lapse rate in the environment can dry air ascend very high.
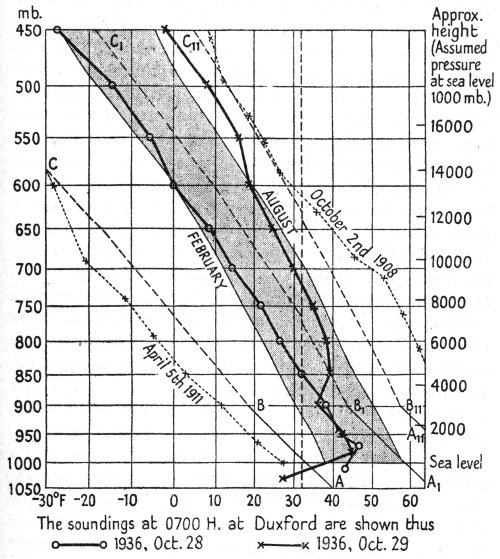
FIG. 10. UPPER AIR DATA.
The soundings at 0700 H. at Duxford are shown thus
o——o 1936, Oct. 28 ×——× 1936, Oct. 29
But in practice the rising surface air usually reaches its dew-point after ascending not more than a few thousand feet, and thereafter it cools at the saturated adiabatic lapse rate, which is only about half the dry rate, and is less than the mean lapse rate in the troposphere. Hence it has a better chance of maintaining its heat advantage over the environment, and it may ascend to a great height with the formation of enormous towering clouds. The best example is seen in the cumulo-nimbus clouds which tend to build up in summer when damp, warm surface air is overrun by cold polar air; and if in addition the surface is heated by the sun the instability may give rise to clouds with their base at perhaps 3,000 ft. and their summit at well over 20,000 ft., from which heavy showers of rain and hail, often with thunder, may fall.
In trying to forecast the amount and kind of cloud, the meteorologist has to make all possible use not only of the lapse rate which exists when the forecast is issued, but of the likely changes in it due to surface heating or cooling, or the arrival of a new air mass. The diurnal surface heating is most important in summer. The humidity of the air at the several levels must also be taken into account. It is not only the surface air that may be involved, for vertical mixing occurs between higher layers, forming cloud and rain.
Inversion of Temperature. It is desirable to consider more fully this stable type which is frequent and has a great effect on weather. If the temperature increases with height, instead of decreasing in the normal way, the lower air cannot rise, but is confined to its own level as effectively as if it were roofed over, so that the term ‘ceiling’ or ‘lid’ may be applied to the inversion. The soundings on Oct. 29, plotted in Fig. 10, reveal a pronounced inversion. The temperature need not actually increase with height to act in this way; if the lapse rate is appreciably less than the adiabatic the result is the same. Inversions are usually at from 500 ft. to 2,000 ft., but they may occur at any level. Of their many pronounced effects the first is that they prevent rainfall, since no large-scale ascent of air is possible, and the small ascent that is possible will hardly give more than drizzle. Secondly, fog is frequent, especially in the night and early morning, for the stagnant surface air becomes chilled below its dew-point, and the vapour and droplets of water cannot be carried up and dissipated. In winter the sun’s heat is often too weak to give the fog-laden air buoyancy even in the day, and the fog persists day and night. Thirdly, a pall of stratiform cloud sometimes extends unbroken at the inversion level for great distances; this is partly an effect of turbulence, and it is described under that heading. Lastly, the surface air 47 becomes charged with dust and other particles which, like the fog just mentioned, are trapped and spoil the visibility. The smoke from large cities may be carried along in the surface wind, and cause considerable obscurity even far from its source, an effect which is only too common over great areas in England, and often occurs when the wind is north-east, for inversions are then frequent. When the air is calm and the surface cold, the smoke may be carried up to the inversion and there remain trapped, a dense pall, so that the sky is almost black even at midday, and it is quite dark below. Such elevated fog is well known in London and other large cities.
The clean white country fog of early morning, only a few hundred feet deep so that the blue sky is almost visible overhead, is pleasant as the forerunner of the bright cloudless day which may be hoped for as soon as the sun’s heat breaks down the surface inversion. But the unbroken layers of stratiform inversion cloud, usually grey rolls of strato-cumulus covering the sky from horizon to horizon, which are a frequent accompaniment of anticyclonic weather, form one of the least attractive skies.
Strong inversions of temperature are the normal condition over vast areas of the sub-tropics, throughout the regions of the Trade Winds on the oceans, and in winter over the lands also in the same latitudes. The temperature decreases from the surface for about 5,000 ft., and then often actually increases for the next 1,000 ft., so that it may be 10° F., or even more, higher at 6,000 ft. than at 5,000 ft. The height and the magnitude of the inversion vary, but over the sea they seem to be closely related to the latitude and to distance east or west from mid-ocean. Travelling anticyclones in the sub-tropics often show very pronounced inversions. Many weather features are a direct result of the inversion.
The Troposphere and the Stratosphere. The adiabatic change of temperature with height is a fundamental 48 physical principle. Where there is no change there can be no vertical interchange of air taking place. The mean decrease in temperature with height, as found by observations all over the world, was apparently so universal and uniform that great surprise was caused in the early years of this century when thermometers were sent up to great heights by means of free balloons and it was discovered that the decrease in temperature continued upward only to a certain level, and there ceased almost suddenly. Above that level the temperature remained almost the same, as high as balloons could penetrate, and some ascents even showed a small increase. In the British Isles the critical height is about 10 km. (6 miles), where the mean temperature is about -60° F. (-51° C.). Above this there may be an increase of about 10° F. (5½° C.) as high as balloons have reached. The level at which the decrease ceases or is reversed is called the tropopause. The atmosphere below is the troposphere, that above, the stratosphere.
The same general facts have been established in all latitudes. At the Equator the tropopause is at about 17 km. (11 mi.), considerably higher than in the British Isles. At the Poles it is as low as about 6 km. (4 mi.).
There are other interesting differences in the conditions in passing from troposphere to stratosphere. But at any rate the law of adiabatic change of temperature seems to show that large-scale vertical movements of air do not occur above the tropopause.
The trace recorded by a pressure-tube anemometer shows that the wind is never a steady current, but a series of gusts and squalls, with rapid changes of direction. No instrument is necessary to show this in a town on a breezy day, for we cannot fail to notice the gusts and whirls near buildings and at the street corners. But that is only an exaggeration of the normal state of the moving atmosphere. The air-stream is thrown into eddies, large and small, whirling in all directions upward and sideways, by the irregularities of the surface it passes over—hills, rough ground, trees, houses—and the eddies often extend up, to 1,000 ft. or 2,000 ft., sometimes to over 6,000 ft. The stronger the wind and the larger the irregularities of the surface the more vigorous the eddies, but eddies are present even at sea, though they are much weaker than on land. Prominent objects such as hills or isolated buildings give rise to more or less ‘constant’ eddies in a wind of given direction and force (Fig. 11) and the pilot who frequents the district can become familiar with them and allow for them in taking off or landing. The innumerable minor irregularities cause a general churning of the air-stream, the details of the movements being too complicated to be classified (Fig. 12).
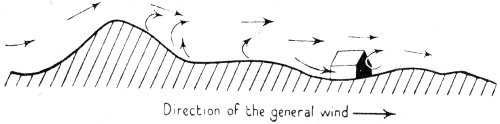
FIG. 11. ‘CONSTANT’ EDDIES CAUSED BY OBSTRUCTIONS.
Direction of the general wind →
Turbulence is much greater by day than by night, partly owing to the greater strength of the surface wind, and partly because the irregular convection currents set up by the heating of the ground add their effect to the mechanical turbulence and also carry the surface air, which is the most turbulent, up to higher levels. On a hot sunny day the bumpiness which is a prominent indication of turbulence to the airman may be perceptible above 6,000 ft.
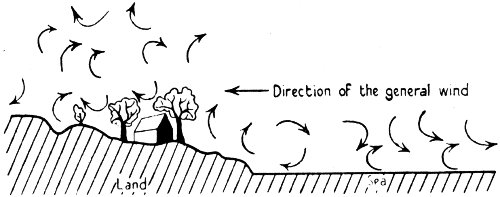
FIG. 12. GENERAL TURBULENCE OVER SEA AND LAND.
← Direction of the general wind
An important effect of turbulence is to carry up in the surface air its solid impurities, the cause of haziness, and dissipate them throughout the turbulent layer, so that they are too much scattered to be very noticeable. The effect is similar to that of convection currents. In particular, water vapour, which is normally most abundant near the ground, is carried up and diffused. Fog, or a tendency to fog, in the surface air may be removed in this way. Turbulence, it should be noted, in contrast to heat convection, is capable of raising relatively cold air, such as frequently collects on the surface on calm nights, to higher levels in spite of its density. In mechanical turbulence heat is carried down to the surface, and vapour up to the higher levels; for the whole body of air affected is in a state of upward and downward movement, and hence assumes the adiabatic 51 lapse rate of temperature. The higher layers may be cooled to dew-point, and give a rather confused mass, some hundreds of feet thick, of stratiform cloud with a distinctive roll-form (whence it is called strato-cumulus). It is a gloomy grey pall, from which, however, no rain falls, or at most a slight drizzle. An inversion of temperature, at or a little above the top of the clouds, forms the ceiling of the turbulent layer. Above it the sky is often cloudless, and the air comparatively warm and dry. These unbroken expanses of strato-cumulus cloud lend themselves to secret flights of aircraft, for a formation can make its way for great distances in them and remain unseen from above and below. The body of turbulent air is rather bumpy, and sometimes, when thermal convection is present, uncomfortably so, in contrast to the steady conditions above.
Cloud-forms seem at first to be of infinite variety, but experience shows that there are only a few fundamental types, or genera, to which the many species belong by virtue of their shapes and processes of formation. Several atlases containing more or less complete classifications are at the disposal of the observer, the best being the International Atlas of Clouds, which was produced in 1932 by collaboration of the national meteorological services. A small, but useful, one is ‘Cloud Forms’, published by H.M. Stationery Office. The use of such an atlas will soon enable the main types to be recognized, and the sky has much of interest to offer to an observer who knows the clouds and can interpret the information they may give about the physical processes going on in the atmosphere. From the practical point of view of the air pilot, they are valuable indicators of the direction and force of the wind at their own levels. The levels of the main types of clouds are fairly constant, and are known from numerous measurements; they may be found in the atlases mentioned. Other uses of clouds are in showing the degree of bumpiness of the air, and in providing cover for aircraft in flight.
Orographic clouds are the result of the forced ascent of damp air to cross a mountain range. They are ragged masses without any very definite form, which completely mask the higher parts of such mountains as there are in the British Isles, and may give heavy and continuous rain. When there are clouds over the surrounding lowlands, produced by general weather influences, the cloud base is lower near mountains, and lower on the windward 53 than the leeward side, coming down to a few hundred feet above sea level. Mountain clouds are obviously dangerous to aircraft which have to traverse them, for collision with the mountain-side is possible unless the exact altitude and position of the machine are known.
Cumulus (Cu), and especially Cumulo-nimbus (Cb), are the most impressive of clouds. They are primarily due to convection, and are the visible expression of instability in the atmosphere. In the British Isles region they are common, since they are associated with the maritime polar air which is the most frequent type of air mass. This air is cold by origin, and contains much vapour derived from its passage over the northern Atlantic ocean. As it advances its surface layers are warmed more and more, for it is reaching warmer regions, while the higher layers are still cold, and the convectional overturnings often produce cumulus clouds massive enough to give heavy showers. But ordinary cumulus clouds that form over land on summer afternoons rarely give rain. For the formation of the really massive cumulus known as cumulo-nimbus there must be instability not only between the surface air and the layer above it, but also at great heights through the atmosphere, an instability which is due not merely to local heating but to the superposition of layers of air of different origin in an unstable arrangement. In these circumstances cumulo-nimbus clouds may build up to 20,000 ft. in a short time, and produce violent rain and thunder. For aircraft a cumulus sky offers an alternation of cover and good visibility. The bumpiness is violent in the clouds, but the clouds can be avoided, a course which is specially necessary in the rainy season in hot lands where they are the scene of dangerously disturbed conditions. In arid lands similar convectional overturnings may carry much dust high aloft, but the low humidity precludes the formation of cloud. The dust tends to spread and form a belt of 54 poor, or even very bad, visibility. The average height of the base of cumulus clouds above the ground is 4,000 ft., of the summits 10,000 ft., and 20,000 ft. or more in the case of cumulo-nimbus.
Alto-cumulus (Ac) clouds may have the same form as ordinary cumulus but they appear much less massive, and they are often arranged in linear patterns, forming waves and sometimes great corrugations. They float at a height of about 15,000 ft., and indicate instability in the atmosphere at their level. A still higher and even more beautiful type is Cirro-cumulus (Cc), ‘mackerel sky’, at about 25,000 ft.
Strato-cumulus (Sc), the most common cloud in the British Isles region, especially in winter, has already been described (p. 51). Its depressing appearance is partly due to its low position, for its base is often within 2,000 ft. of the surface. The layer is of variable thickness, up to about 3,000 ft.
Cirrus (Ci) is the highest of the ordinary clouds, about 30,000 ft. above the surface. It is a very beautiful fibrous cloud, consisting of particles of ice, so tenuous that there are never any grey shadows. It is of practical interest in that it is usually the first sign in the sky of an approaching depression, as much as 500 or 600 miles in advance of the warm front; it is in Cirro-stratus (Cs) cloud, a hazy veil at about the same height, that solar and lunar halos are seen, an effect of the refraction of the light by the ice particles.
Stratus (St) is the name applied to clouds with length and breadth but no very obvious vertical structure, in contrast to cumulus, in which the vertical structure is the prominent feature. Typical stratus clouds are seen about sunset in fine weather, being formed frequently from cumulus clouds when their thermal ‘lift’ fails them. In so far as they depend on a stable stratification of the atmosphere they tend to indicate settled weather.
The stratus which more frequently concerns the meteorologist is the series of clouds in advance of a warm front. Cirro-stratus, the highest of these, at about 30,000 ft., is seen several hundred miles in advance of the front, and is often distinguished by its halos, harbingers of ill omen. This gradually thickens with the addition of lower cloud, the series called Alto-stratus (As), at a height of about 15,000 ft., being still thin enough for the sun or moon to show through it as a watery disc, though it often gives rain. The clouds soon thicken further to a dark grey rainy pall through which the sun cannot be seen. Finally, low thick stratus, called Nimbo-stratus (Ns), extends to the front itself, and usually gives steady rain for hours; its level decreases from about 10,000 ft. to almost the surface at the front itself.
In certain conditions clouds may cause ice to form on aircraft flying through them, a source of the greatest danger owing to the increase in weight, the disturbance of balance and stream lines, and the blocking of air inlets.
The importance of good visibility is greater for aircraft than for other forms of transport. To locate an aerodrome in a fog and to land successfully is even more difficult than to take-off. Once aloft a good navigator may proceed best by rising above the fog. But the pilot of a small machine, who depends on the use of landmarks, is seriously hampered if the visibility is less than 2 miles.
The visibility is observed by noting the distance at which known objects cease to be visible. The scale commonly used is:
| Objects not visible at | |||
|---|---|---|---|
| 0 | Dense fog | 55 | yards |
| 1 | Thick fog | 220 | ’ |
| 2 | Fog | 550 | ’ |
| 3 | Moderate fog | 1,100 | ’ |
| 4 | Mist or haze | 2,200 | ’ |
| 5 | Poor visibility | 2¼ | miles |
| 6 | Moderate visibility | 6¼ | ’ |
| 7 | Good visibility | 12½ | ’ |
| 8 | Very good visibility | 31 | ’ |
| 9 | Excellent visibility, objects visible at 31 miles | ||
The scale intervals are smaller for the lower numbers, where finer subdivision is desirable. But no scale can be very precise, for the distance depends in part on the nature and colour of the object observed and to a large extent on the direction of the lighting. The visibility aloft may vary with altitude, and it also depends on the nature of the mist layer, and on both the horizontal and vertical directions of the line of sight. Fog and mist normally consist of minute droplets of water, haze of solids such as dust or smoke; mist is a less dense form of 57 fog. But a state of very bad visibility, even if due to solids, would be called fog.
Two main factors are necessary in the production of fog, a source providing the liquid or solid particles, and such stability of the atmosphere that the particles are not scattered, but remain concentrated. The water droplets result from the cooling of air below its dew-point. This often happens on land during the long nights of winter when the sky is clear and the air calm, and the layer of chilled dense air with its droplets in suspension drains into the hollows. Valleys are soon filled with a deep lake of fog, and if the necessary atmospheric conditions persist the fog layer may attain a depth of more than a thousand feet over wide expanses of country, and spread several miles over an adjacent sea. This winter fog is the ordinary type on land.
At sea, fog is most frequent in late spring and summer, and it is well known on the south and west of the British Isles where it often encroaches some distance inland. Unlike the radiation type of land fog just described, which requires calm air, it is due to the moving of warm air over a cooler sea surface, the air being usually maritime tropical air which starts warm and humid in the neighbourhood of the Azores, and is more and more cooled in its passage to the British Isles as it reaches cooler and cooler water. The surface air is more chilled than the higher layers, so that the air mass is stable, and it is almost at its dew-point before it reaches north-west Europe, where contact with the cool seas round Britain often causes dense fog. The land is much warmer than the sea in summer, and with advance inland the fog-laden air soon clears. At sea, however, the fog may persist for several days, as long as the supply of tropical air continues, without the wind becoming strong and turbulent enough to dissipate it. An interesting example of a similar process of fog formation sometimes occurs on 58 land in winter, when a warm damp wind arrives from the sea, and blows over land that is still snow-covered or frozen after a cold spell.
The condensation of vapour into droplets of water commonly takes place on minute solid particles, such as crystals of sea salt derived from the evaporation of sea spray, and certain products of fuel combustion which are always present at any rate in the lower layers of the atmosphere. They are known as hygroscopic particles. It has been shown that these nuclei cause condensation long before the air is saturated with vapour, in many cases when the relative humidity is only about 75%, but the droplets remain extremely minute until saturation point is reached, and then they grow rapidly. Possibly the condensation in unsaturated air is enough to give mist, but it requires full saturation to produce dense fog.
Haze, with visibility as low as 2 miles or less, is only too frequent in a densely populated industrial country like England and the midland valley of Scotland. Fortunately the vigorous dissipation by convection and strong turbulent winds prevents large cities being perpetually covered by a pall of thick black gloom, but at times when the air movement ceases such a condition does occur. The meteorological conditions required are nearly calm air and an inversion of temperature due either to great surface cooling by radiation on clear winter nights, or to an inversion in the atmosphere some hundreds of feet above the surface which prevents convection. In calm winter weather the sooty products of combustion are usually added to the wet fog, which becomes a yellowish black murk of great intensity.
If there is a wind beneath an inversion the industrial pollution may be carried for hundreds of miles across the country, and cause poor visibility of as little as 1 mile or less. Such industrial haze is a frequent accompaniment of the east and north-east winds which blow across 59 the British Isles under the influence of an anticyclone centred to the north, with an extensive inversion of temperature at 2,000 ft. or 3,000 ft. An almost unbroken sheet of strato-cumulus cloud near the inversion adds to the gloom. But if an aeroplane rises above the layer of cloud it usually finds a bright clear atmosphere with deep blue sky.
Another type of haze consists of fine dust blown up from the ground in arid lands. It is very variable in kind, height, distribution and duration. In deserts like the Sahara it may be thick enough to make lights necessary on vehicles in the middle of the day where there is traffic. The dust is carried in thick whirls up to 5,000 ft., and at times much higher, under certain meteorological conditions.
The mean distribution of atmospheric pressure over the globe was sketched in Chapter IV. In low latitudes the distribution on any day may not differ much from the mean, but in the Westerlies large discrepancies are usual, and they must be closely examined since the daily weather is intimately connected with them. The routine reports from observing stations include not only the reading of the barometer reduced to sea level, but also the tendency, or change in pressure since three hours before, and the characteristic, which means the form of the trace of the barograph, in the past three hours; the latter is expressed by code figures agreed on to indicate the usual forms of trace. When the readings are plotted, isobars can be drawn on the synoptic chart, and they are, perhaps, its most valuable feature, since they outline the pressure systems. In addition to this it will be remembered that the air currents flow along the isobars, so that these mark the tracks followed by them from their place of origin, possibly to meet in combat at a front. However, the synoptic chart gives only an instantaneous picture at a certain time, and the tracing back of the track of the air masses usually requires a series of charts, and considerable experience in their use.
An endless variety of pressure systems can be seen on synoptic charts, but in spite of the differences certain types with marked similarities recur frequently. In classifying them the first main distinction is between high-pressure and low-pressure systems, the pressure increasing toward the interior in the former, and decreasing in the latter.
The high-pressure type is the anticyclone, an example 61 of which is to be seen in Fig. 21 over France and the Bay of Biscay. Most anticyclones are large, and the central area has very slight barometric gradients, so that there are calms or light and variable winds. Outside this the winds blow outward in a clockwise direction. Some systems, especially in summer, have almost cloudless skies, with bright sunshine and high temperature by day; at night the ground loses its heat rapidly under the clear skies, and the air temperature soon falls, so that the range from day to night is large. But many anticyclones give cloudy and even very gloomy skies, sometimes with drizzle. Anticyclones tend to be inert and sluggish systems, and when they move their course is slow and erratic.
Another form of high-pressure system is the wedge. In Fig. 19 a wedge covers the British Isles and extends far north. Wedges are projections from systems of higher pressure. In our region they usually point north, and separate two depressions. The front of the wedge has a current of polar air from a northerly point, and in the rear the wind is southerly, preceding the new depression. Between, the axis of the wedge has calms and almost always very clear skies. Unlike the larger anticyclone a wedge moves rapidly, retaining its main features; with the cyclones it separates.
Low-pressure systems are much more common in the British Isles region, as in the Westerlies everywhere, than high-pressure. A low-pressure system, or depression, sometimes called a cyclone when the enclosing isobars are circular, is north of Iceland in Fig. 19. The winds blow inward and are deflected by the Earth’s rotation so as to have a generally counter-clockwise direction in the northern hemisphere, but their arrangement is far from uniform or symmetrical, as is also the general weather. The wind is often strong, the sky cloudy, and the weather unsettled to rainy. The weather in the different parts 62 is explained in Chapter XIII, in relation to the air masses and fronts which are characteristic. Some depressions are small, others more than 1,000 miles across. In the north Atlantic region most of them move towards the north-east, but the variability of their tracks is seen from Fig. 13. Their speed also is variable, the average being from 10 to 30 miles an hour. Thus in many ways the depression is the opposite of the anticyclone.
Modifications of the circular depression are numerous. The secondary is a minor and subsidiary low-pressure system. It may be indicated on the chart merely by a local bulge in the isobars of the main depression, but sometimes the bulge extends so that the secondary attains, and even exceeds, the size and importance of the parent system, and repeats its weather characteristics. In Fig. 19 there is a depression over the Gulf of Bothnia which is a secondary to the system on the north.
One form of secondary narrows southward in a V shape, and sweeps along like a scythe. The gradients may be steep, facing each other across the axis, and the winds strong, from opposed directions on the two sides and therefore differing strongly in temperature and humidity, and so giving rise to a vigorous front with violent weather phenomena. The northerly wind in rear often arrives as a strong squall of cold dry air which undercuts the warm southerly air in front, and produces a dense roll of cloud and a heavy shower of rain or snow or hail, perhaps with thunder and lightning. Such a disturbance may extend in a line 100 miles long or more, and it is sometimes called a line squall.
Inspection of synoptic charts soon reveals other forms of pressure systems, and the study of weather is based largely on the recognition of the forms and the associated weather in any given circumstances.
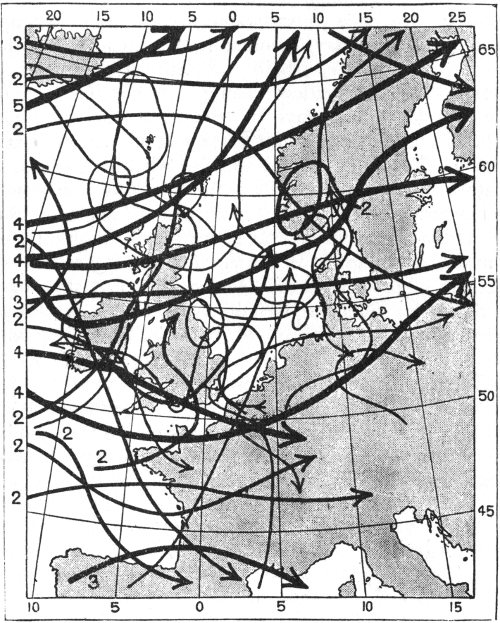
FIG. 13. COURSES OF DEPRESSIONS, 1926.
(The figures indicate the number of depressions following each track.)
The individual pressure systems that have been mentioned may be regarded as the primary units of the atmospheric circulation. But depressions of similar form tend to recur, a series appearing in the same neighbourhood, following similar tracks and giving much the same weather sequence. And anticyclones may remain, sluggish or stationary, dominating vast areas. Thus the same pressure type, whether a static one as in anticyclones or the restless change of depressions, may continue for several days, or even weeks, and the same type of weather persists over the region, often a very large region. Examples are our spells of north-east winds, a feature of spring especially; the weeks of fine sunny anticyclonic weather—not so frequent—in summer; the succession of cyclonic storms in any season but mostly in autumn and winter, in which it is the succession of changes of pressure, winds, temperature and skies that is repeated. Such are definite types, and it is always useful to pay attention not only to the individual systems, the primary units, but to this grouping and sequence. A major classification can most often be based on the extensive stationary high-pressure, or occasionally low-pressure, systems, rather than on any one of the smaller units. Many schemes of classification into types of this kind have been suggested and are used.
Charts of mean monthly isotherms (Figs. 1 and 2) are interesting and valuable for many purposes, but in such an area as north-west Europe, with its irregular changes of wind and weather, one of their chief uses is to indicate the probable quality of air masses arriving from any region.
Air mass is the term applied to a part of the atmosphere large enough to play an appreciable part for a period of at least some hours in the meteorology of any region; it is more or less uniform in its physical character, mainly in respect of temperature and humidity. Most synoptic charts show the presence of several air-masses, each covering an area of at least a quarter of a million square miles and many a much larger area. The shape is very variable. Most have one or more sides with a sharp boundary, which may be a ‘front’. The recognition of the air masses and their qualities is our first work in studying the chart. The air mass acquires its physical character in its origin or source region, which is a region of marked meteorological individuality. A good example is Greenland, a large and lofty ice-covered island, intensely cold in winter and with a mean air temperature well below freezing point even in summer. If a mass of air remains on Greenland for a few days it becomes very cold and dry, and it is then said to be continental polar air. Clearly the temperature and humidity will depend largely on how long the air remains on the cold ice surface, and on how still it lies, but in spite of differences the air mass will be of a definite type. If the pressure distribution is such that this polar air is moved away from its source to the British Isles it will still retain very 66 perceptible traces of its sojourn in Greenland when it arrives, but in its passage over hundreds of miles of warm ocean it will become much less cold and dry. The extent of the modification varies according to the time it takes to make the passage, but it must be modified in some degree, and this is indicated by the name, maritime polar air, which it receives after its modification.
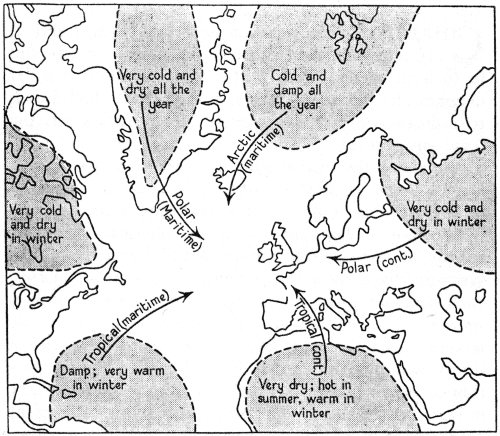
FIG. 14. SOURCE-REGIONS OF AIR MASSES WHICH FREQUENTLY REACH THE BRITISH ISLES.
The main air masses are Polar and Arctic, and Tropical, and each of these can be either continental or maritime according to its source region and the route it has followed.
Fig. 14 shows the chief air masses which the British meteorologist has to consider. The most frequent is 67 maritime polar air. The warm sectors of depressions usually consist of maritime tropical air which has originated in the sub-tropical Atlantic. Continental polar air from north Russia and Siberia is rather rare, but it is a most prominent visitor when it arrives in winter, for it brings our coldest weather with long-continued frost. At the other extreme, some of our hottest days in summer occur with continental tropical air from the Sahara. However, though many air masses can be easily classified into the commonly recognized types, a large number are intermediate in their qualities, and no rigid classification is possible. The important point is to notice the exact qualities, for that is what controls the weather experienced in the air mass itself, and it is the actual difference in quality, rather than the ultimate origin of the air masses, which determines the nature of any frontal disturbances between them.
Polar air, and especially continental polar air in winter, is very cold and dry in its source region. In the British Isles it sometimes happens, as mentioned above, that such air arrives from north Russia and Siberia, having travelled over Russia, Poland, and Germany, a frost-bound land area, so that the air is still very cold and dry when it reaches the Low Countries and north-east France. If the air makes the passage from there to England over the narrow part of the North Sea and the English Channel it is not much modified, and is still very cold and dry, possibly with almost cloudless skies, in England. Polar air from Greenland or the Arctic Ocean, on the other hand, is greatly modified during its long ocean passage. The surface of the sea is much warmer than the polar air, for most of it has a temperature above 35° F. even in midwinter. The polar air starting its southward journey with a temperature of -20° F. or less, is rapidly heated from below, and convection currents are setup; moreover the comparatively 68 warm sea pours vapour into it. Thus the air mass reaches England much warmer and damper than at its source. Other results of the ascending convection currents are the formation of a good deal of cumulus cloud, and good visibility owing to the diffusion through a considerable depth of air of any surface murkiness, which is so much scattered as to be innocuous. Thus typical maritime polar air is decidedly cool, but not very cold, and damp but not saturated. The sky is a bright blue between the white cumulus clouds, which, however, at times may develop sufficiently to give sharp showers of rain, snow or hail, and sometimes passing thunder. Visibility is very good, and the conditions generally exhilarating, but there is one disadvantage for flying, in that the air is very bumpy, as is usually the case where convection is taking place.
The history of maritime tropical air is quite different. In its passage to the north and north-east this air reaches cooler and cooler water, so that the air is stable and no convectional overturning takes place. There is little or no tendency to the formation of cumulus cloud, or to bumpiness, and such murkiness as the air contains remains in the lowest layers, where consequently the visibility tends to be rather poor. If the sea surface is notably cooler than the air, as off the south-west of the British Isles in early summer, there may be much fog.
The fog is formed in the surface layers, which are very rich in vapour and near the dew-point in the case of maritime tropical air, since the stability confines the vapour to the lower layers instead of allowing it to diffuse. The air is damp owing to the nature of its source region, and it picks up more vapour on its long sea journey. Low cloud of a stratiform type, as well as fog, is characteristic.
The character of other air masses may be analysed 69 similarly, but it must be remembered that when continental air masses travel over the sea, and when maritime air masses reach land they are subject to new influences, which vary with the season. It may usefully be repeated here that the classification of air masses into a few types introduces an artificial simplification. The actual physical qualities of the air mass in relation to its environment must be considered if any approach to exact analysis is attempted.
It may sometimes be noticed where a tributary enters the main river, the water of the one being muddy, of the other clear, how the two streams flow side by side for a mile or more with the line between them sharply marked, until they mix together through continued turbulence at their junction. Similarly, in the atmosphere, air masses may advance side by side, each retaining its individuality, with a sharply marked line of separation or discontinuity. If the air masses are of different densities the discontinuity will not be a plane perpendicular to the surface of the ground, but a gentle slope, for the denser air will force itself wedge-like under the edge of the lighter. The discontinuity becomes less sharp owing to turbulence as times goes on. If an air mass overtakes its neighbour, it will override it if it is less dense, that is warmer and damper than its neighbour, and undercut it, raising it from the ground, if it is denser. The discontinuity is then known as a front.
Fronts are prominent features in the structure of the low-pressure systems which are responsible for the bad weather of the Westerlies, including our own region. There are two main air masses involved, cold polar and warm tropical, which come into contact and conflict, over the north Atlantic somewhere between the region of the Azores and Spitsbergen.
The main stages in the development of a depression according to the Norwegian School of Meteorologists are shown in Fig. 15. Between the two currents of air flowing past one another (A), a wave forms, the warm air 71 protruding into the cold (B). The intrusion forms the warm sector of the young depression, the cold air being deflected behind it so as to overtake it from a north-westerly direction; the warm sector is enclosed by the warm front on the east, and by the cold front in rear. The cold current is advancing more rapidly than the warm sector and overtakes it so that it is lifted from the surface, the cold front finally overtaking and coalescing with the warm front to form an occlusion (C); the depression is now said to be occluded, and its surface layers consist entirely of the original cold air, the part behind having come round north of the centre. In its last stage (D), the dying depression is a more or less inert whirl of air. But before stage (D) is attained a secondary forms in many cases on the south of the occlusion; and other disturbances frequently arise behind the original depression and in association with it.
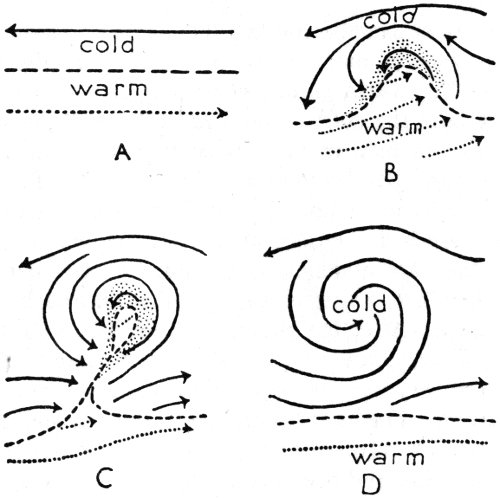
FIG. 15. STAGES IN THE DEVELOPMENT OF A DEPRESSION.
The process of development outlined above can often be followed more or less convincingly in a series of synoptic charts covering the whole of the north Atlantic and western Europe when there are enough reports from ships to complete the details of isobars and weather over the ocean.
The structure of the depression in its most active stage is seen in more detail in Fig. 16. In the middle diagram the warm sector, consisting of westerly winds, is overtaking the cold air, and has to ascend the slope of the wedge as seen in the lowest diagram; the average slope is found by observation to be about ½°. The ascent causes adiabatic cooling and the formation of cloud. The highest clouds are cirrus, at a height of about 5 miles, and as they are as much as 500 miles in advance of the front they are a useful sign of the approach of the disturbance. After the cirrus, cirro-stratus, possibly with a halo, follows, and it soon thickens to alto-stratus, in which a watery sun or moon indicates the closer proximity of the front. The cloud continues to thicken and darken, and becomes nimbo-stratus. Meanwhile, continuous rain has begun, and becomes heavier up to the neighbourhood of the front itself. The rain is the result of the condensation of vapour in the rising tropical air, but it falls through the cold air mass below in which the wind direction may be east or north-east, and seems to the observer on the ground to be brought by the cold air. At the front the clouds are very low and massive, so low that they may even reach the ground and appear as fog.
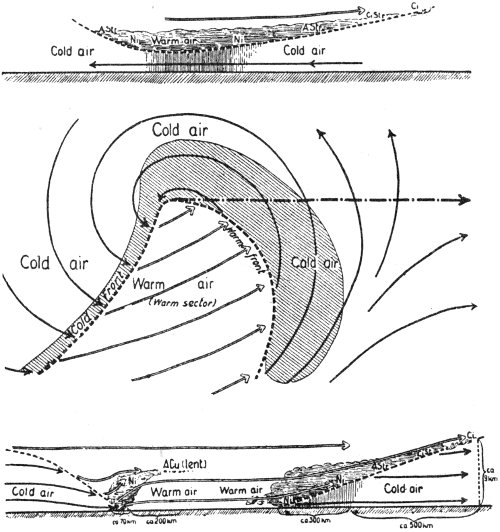
FIG. 16. STRUCTURE OF A DEPRESSION.
The top diagram shows a cross-section in the cold air to the north of the centre, and the bottom diagram one in the warm air to the south of the centre.
When the front is well past, the rain stops and the sky brightens in the warm sector, though there is usually a good deal of stratus cloud and some rain. Behind the warm sector the cold air mass is pushing on more rapidly and undercuts it, forcing it up vigorously with the formation of masses of cloud, mostly of a heavy cumulus type, and heavy rain. Sometimes the front of the advancing cold air descends like a cataract, and there is a violent disturbance, fierce squalls of wind, dense rolls of cloud and a heavy downpour of rain or snow and hail, with thunder, but more usually the weather is less disturbed, though still much more spectacular than at 74 the warm front. The slope of the wedge of the cold air mass is steeper than that in front of the warm front, the average being about 1°.
Flying conditions are always uncomfortable, and can be dangerous, in a cold front. The clouds are dense up to a great height, there are strong upward currents giving extreme bumpiness, and in some places dangerous down draughts. The safest course is to cross the front above the level of the most massive cloud, steering a course between the protruding heads of cumulus.
Behind the disturbance at the cold front the rear of the depression consists of the cold polar air. Temperature falls suddenly as it arrives, and the sky clears to a deep blue, but there is much cumulus cloud over the sea, and by day over land also, owing to the heating of the lower air by the surface it is passing over, and sometimes these clouds are massive enough to give passing showers of rain. But most depressions have not only one, but two or more fronts in the cold air, for polar air masses usually contain several sectors with more or less vigorous fronts separating them; tropical air is more homogeneous.
In the process of occlusion already referred to the warm sector is gradually narrowed, being raised both in front and rear till it is removed entirely from the ground, and forms a mass of cloud some thousands of feet above the surface, which gives a wide belt of rain on both sides of the line of occlusion, or occluded front, on the surface where the cold air in rear reaches the cold air in front. Not only is the warm sector lifted bodily, but there will be elevation of one of the cold air masses at its meeting with the other, for they usually differ in temperature and humidity, so that the occlusion contains a form of cold or warm front. The occlusion of the warm sector takes place rapidly in the early life of a depression. Most systems which reach Britain from the Atlantic are occluded before they arrive, and have only polar air masses.
The process of occlusion begins at the apex of the warm sector, near the centre of the depression where it is narrowest, and extends outwards. As it proceeds the centre of the system tends to move along the occluded front, which is thus left trailing behind and may be carried southward in the polar air, sweeping along as a new front over the area already swept by the main occlusion (Fig. 17). It is one cause of the bad weather which is only too liable to recur after the main cold front, or occluded front, of a depression has passed.
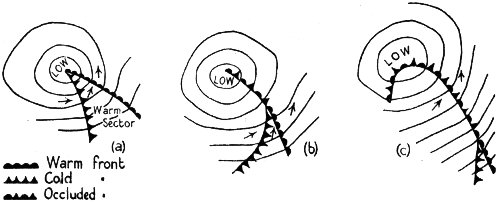
FIG. 17. THE OCCLUDING OF A DEPRESSION.
The description of a depression just given has been limited to the air masses and fronts. But the most prominent feature of the representation of a depression on a synoptic chart is the series of closed isobars with the lowest pressures in the middle. And this explains the old popular association of the weather with the changes in the barometer, for as the depression approaches pressure falls—‘the glass goes down’—and after it has passed rises again. The pressure distribution is certainly a very significant feature, both from the point of view of forecasting and as a physical fact in the structure of the system. But it must be noted that the arrangement of wind and weather is by no means concentric like the isobars, but rather linear, being associated with the fronts. The isobars serve a minor but useful purpose on the chart in forming a framework, linking together into one unit the various elements of the system.
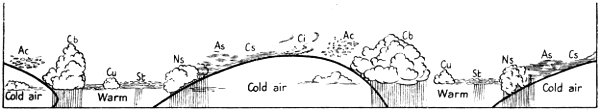
FIG. 18. SECTION THROUGH TWO DEPRESSIONS.
Ac, Alto-cumulus; As, Alto-stratus; Ci, Cirrus; Cs, Cirro-stratus; Cu, Cumulus; Cb, Cumulo-nimbus; Ns, Nimbo-stratus; St, Stratus.
We now recapitulate the conditions in the main sectors of a depression, as experienced by an observer on the south of the centre approaching him. In the cold air mass in front the barometer falls steadily. The wind is steady at first from a point between SW. and E., but tends to back near the warm front. Temperature is low, and may be very low in winter. The sky grows more and more cloudy, cirrus appearing first, then cirro-stratus, alto-stratus, and finally dense low nimbus, usually with some watery-looking cumulus below. Rain, or snow, begins to fall from the alto-stratus cloud, and continues steadily.
At the warm front the barometer ceases to fall, and the wind veers a few points. Temperature rises appreciably. The clouds are very heavy and low, and the rain still heavy, on both sides of the front, and with a feeble front there may be a narrow belt of fog.
In the warm sector the barometer remains low and fairly steady. The wind is between S. and W., steady. Temperature is much higher than in the cold sector, and may be very high in summer on land if the sky is clear. But the sky is variable, usually having a good deal of stratiform cloud, sometimes dense enough to give rain, and there may even be thunder in summer.
At the cold front there is a sudden change in all the elements, in contrast to the more gradual transitions previously. The barometer rises, often with a sudden jerk of as much as a millibar. The wind suddenly veers through several points, and may come in as a sharp squall from NW. Temperature falls suddenly through 5 or 10° F. or more. Dense rolls of cloud or towering 78 cumulus give heavy showers of rain or snow, sometimes with hail and thunder.
In the cold air behind the cold front the barometer continues to rise. The wind backs a point or more from its direction at the cold front, and may blow strongly (especially when the rise of the barometer is rapid). Temperature is low, the sky is bright and of a deep blue between the cumulus clouds, which grow in number and size especially over the sea or a warm land.
This analysis indicates that the frontal zones, the lines of conflict between air masses, are the scene of the most striking weather, being divides between the more constant conditions in the body of the air masses. Some fronts are very active, others inert. Their vigour depends on the degree of contrast between the conflicting air masses, and on their relative movements. Most depressions contain many minor fronts which are not shown on the published synoptic charts, but are perceptible enough to the observer. On the other hand, fronts are often pronounced enough to be inserted, which are not related to a depression in the diagrammatic way that has been described, some of them being old fronts left behind the systems in which they originated.
The description given in this chapter refers to a fully developed circular depression still in the vigour of youth. Such depressions sometimes appear in series of four or five in the west of the Atlantic and follow one another north-eastward, the track of each being a little south of its predecessor’s. A section through two such systems is given in Fig. 18. However, many disturbances are by no means such clearly defined systems, outlined by closed isobars. But the attempt must be made, by careful examination of their details, to analyse their air masses and fronts in the same way, and to gain an idea of the structure.
Since fronts are the expression of the conflict of air 79 masses they are associated with low-pressure systems, in which air currents converge. Anticyclones, being systems of diverging winds, are by their nature devoid of fronts. But it not infrequently happens that fronts, with their own localized low-pressure arrangement of isobars, invade an anticyclone from the atmosphere outside it, and at first sight appear to be parts of it.
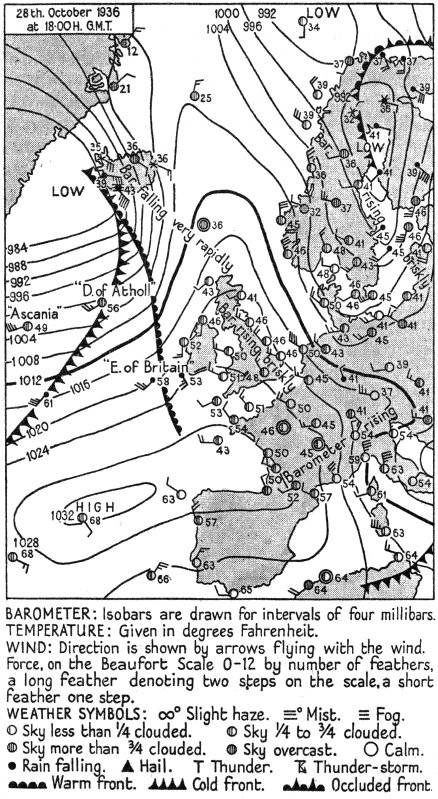
FIG. 19. DAILY WEATHER REPORT, 28 OCTOBER 1936, EVENING.
BAROMETER: Isobars are drawn for intervals of four millibars.
TEMPERATURE: Given in degrees Fahrenheit.
WIND: Direction is shown by arrows flying with the wind. Force, on the Beaufort Scale 0-12 by number of feathers, a long feather denoting two steps on the scale, a short feather one step.
WEATHER SYMBOLS: Slight haze. Mist. Fog. Sky less than ¼ clouded. Sky ¼ to ¾ clouded. Sky more than ¾ clouded. Sky overcast. Calm. Rain falling. Hail. Thunder. Thunder-storm. Warm front. Cold front. Occluded front.
It has been shown in the previous chapter that depressions are always in process of modification, and their study includes not only their form at the moment but the changes taking place. Moreover, the systems as a whole travel, and both the track and speed have to be considered. For the purpose of forecasting there is little value in knowing that there is a depression with certain characteristics in some part of the north Atlantic unless we also know the direction and speed of its advance and hence the way in which it will affect us.
Figs. 19-21 show the travel of a depression with well-marked fronts. On October 28 at 18.00 H. (6.00 p.m.) it is centred south-west of Iceland, off the chart. To the south-east a large warm sector opens out southward. East of this the air is cooler in the area including the British Isles and extending far north, the temperatures in the British Isles ranging from 53° F. at Valentia to 41° at Aberdeen. The warm front is the divide on the surface between this cold air and the warm sector where ships report 56° and 58° F. with SW. winds. The western boundary of the warm sector is the cold front, behind which is another cold air mass, the Ascania reporting 49°. In front of the warm front (occluded off Iceland) steady rain or snow is falling, with S. to SE. winds. In the warm sector skies are overcast, and two of the ships report rain with SW. wind. In the rear of the cold front the Ascania reports clearing sky with a strong SW. wind. On the following evening (Fig. 20) the same features are clearly recognizable, the system having moved eastward so that the warm sector covers the British Isles, where temperatures are 5° to 10° F. higher than in the previous chart. The cold front is crossing Ireland, the wind having already veered sharply and the temperature fallen in the north-west. The occlusion of the warm sector has extended farther south, and the occluded front has advanced rapidly north-east. Meanwhile, the low-pressure centre has been moving north-north-east, and at 07.00 H. on October 30 (Fig. 21) it is between Jan Mayen and Greenland. The fronts have all moved eastward with little change except that the cold front is almost stationary over Ireland and to the south-west.
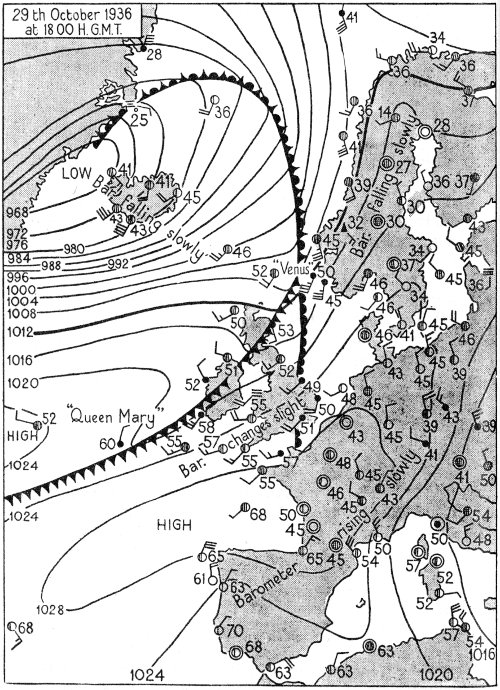
FIG. 21. DAILY WEATHER REPORT, 29 OCTOBER 1936, EVENING.
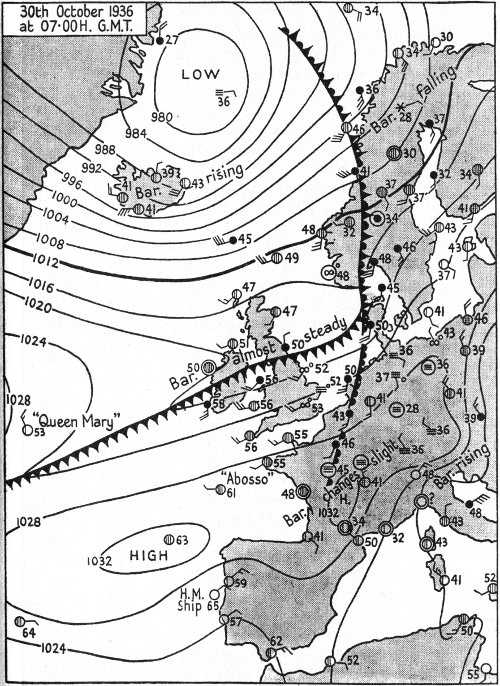
FIG. 21. DAILY WEATHER REPORT, 30 OCTOBER 1936, MORNING.
Fig. 10 gives the upper air temperatures at Duxford at 07.00 H. on these days. On October 28 the readings are low for the season, for at the time of the ascent a fresh current of polar air was blowing in rear of an elongated depression over Scandinavia. On the next day the upper air is much warmer, with a rise of more than 20° F. at the higher levels, but the warmer air is found only above 4,000 ft., and below that level the temperature is the same as 24 hours before. The warmth aloft may be due partly to the cessation of the polar wind, partly to the arrival of the warm sector of the approaching depression. Another point of interest in these soundings is the temperature in the first 1,000 ft.; on October 28 the wind blew freshly enough even in the night to check the formation of a cold, stagnant surface layer, but on October 29 an almost calm atmosphere and a clear sky caused a surface inversion of almost 20° F.
Depressions tend to move from west to east over the British Isles region and the ocean to the westward, and probably no more precise general rule can be laid down, for no two systems follow exactly the same track. But it is found that the following principles are a useful guide. Depressions continue in the direction they have been following, which is known if synoptic charts for previous hours are 85 available. They move in the direction of the isobars in the warm sector near its apex. They move towards the area where the pressure is falling most rapidly, and away from the area where the rise is most rapid, and for this reason the amount and nature of the change in the barometer in the three hours before the time of observation is part of the message sent in by all reporting stations. One or more of these rules can be applied in many cases. But clearly they do not carry us very far, for the characteristics used as guides are themselves always changing, and hence giving different indications.
The speed of advance of depressions is very variable. Different systems move at different speeds, and the speed of any system is itself constantly varying. Sometimes there is hardly any movement for days, but the ordinary speed is between 10 and 30 miles an hour. Probably the best guide is the previous speed of the system which, it may be assumed, will be continued. But evidently this can only be of use for short-range forecasts.
Not only is the speed and course of the system as a whole important, but also the movement of the fronts in it, with which weather is so intimately connected. The fronts are carried along by the air mass behind them. Their direction and speed can be found by comparing their positions in the previous synoptic charts. And the working rule has been established that the speed of cold and occluded fronts depends on the speed of the geostrophic wind behind them (see p. 31), and on the angle of inclination of the wind to them, the stronger the wind and the more nearly perpendicular its direction to the front, the more rapid the movement of the front. Warm fronts depend similarly on the wind in the warm sector, but they move considerably more slowly than cold fronts for the same wind force and direction. According to this rule, fronts lying along isobars will not move at all. The speed of fronts is so variable that a 86 mean value would be of little practical use. They may remain almost stationary, but not infrequently their rate of advance exceeds 20 miles an hour.
There is the same difficulty in applying rules like these for the movement of fronts as in using the rules for the travel of depressions. The criteria used are themselves always changing, more or less, so that no sooner has a forecast been based on them than it is out of date.
Another matter of practical importance is that depressions not only change their form, but are always in process of deepening or filling up, sometimes rapidly. The barometric changes going on over the whole area give an indication of this.
The two main forms of high-pressure systems, the large, with more or less circular closed isobars, and the small, with wedge-shaped isobars, have been mentioned in Chapter XI among the usual pressure types of the Westerlies. Their fundamental feature is that they have outblowing winds, and hence there are no conflicts between air masses, no fronts with their disturbed weather. The weather tends to be ‘quiet’, and the winds light or almost calm in the central part of the system, though there is often a steep gradient around it where the winds are steady and strong, an example being the strong north-east winds in the British Isles which may blow for weeks at a time.
Anticyclones can build up within our region, and their growth may be traced in the synoptic charts from day to day. Or, more commonly, they are immigrants, either from the far north or from the south-west. The former being of polar origin are cold, but they are gradually warmed from the warmer surface on which they find themselves. The latter originate in the Azores high-pressure region, a region of high pressure almost always, and appear as warm masses of air in our region. These warm anticyclones are in most cases more stable than the cold, and their movement is slower, and indeed they often remain almost stationary.
Since the winds blow outward, always deflected to the right, around high-pressure systems, there must be a descent of air from aloft in the central region to feed them. This air is warmed adiabatically, and therefore dried, so that there is no cloud or mist. But as far as surface weather is concerned this is by no means the 88 end of the story. The clear skies permit vigorous loss of heat from the ground, and, especially during the long nights of winter, the surface layers in a cold anticyclone may become so cold that fog forms, and may persist through the day as well as the night if the air is calm, with a pronounced inversion of temperature at a height of about 1,000 ft. to 3,000 ft. When there is much wind, turbulence may carry the humidity up from the surface, to form strato-cumulus cloud below the inversion by the process explained in Chapter VIII. An unbroken pall of gloomy cloud and a cold north-east wind are thus liable to be associated with anticyclones, an especially unpleasant type of weather, which may persist for days and even weeks. The atmosphere below the cloud layer is frequently hazy, with visibility as low as 1 mile. But a new world opens up if we rise above the clouds, a world of clear air, blue skies and bright sunshine.
The movement of anticyclones is almost always slow and often very erratic. Two useful guides are that the movement in the immediate future is likely to be similar to that in the immediate past, and that, if barometric changes are in progress in the neighbourhood, the system will move in the direction of the most rapidly rising pressure.
A synoptic chart is a chart covering as large an area as is necessary for the understanding of the weather and its developments in the next two or three days, which has, plotted in position on it, the meteorological observations taken simultaneously at numerous stations. The completed chart will contain also the isobars and fronts, and sometimes other information. Uniformity in the types of instruments used for taking the observations (all instruments must be standardized, and the correction, if any, applied to the readings) in the methods of observing and the hour, must be secured by international agreement, for the chart will include parts of several national systems. In north-west Europe all the chief land stations observe at 01.00, 07.00, 13.00 and 18.00 G.M.T., and many at intermediate hours also. Ships at sea observe at 06.00, 12.00, 18.00 and 24.00 G.M.T.
The readings are at once transmitted by telegraph, in code for the sake of brevity, to the various national centres, from which a selection of them is broadcast, to be picked up by the surrounding meteorological organizations, and by any private person who has a receiver. These messages are received within about one hour from the time of taking the observations. They are plotted at once by an assistant and form the basis of the synoptic chart, which can then be completed by the insertion of isobars and fronts.
The meteorologist now has before him, in a convenient form, the available data, and he can use them for his two main objects, the first being to give pilots information on the conditions actually prevailing along any route and especially round places of call, and the second, to 90 prepare a forecast of the weather for three or more hours ahead. For flying purposes, weather includes the force and direction of the upper winds, and, a very important feature, the visibility and the amount and height of the low cloud. Forecasting involves the application of theoretical knowledge to discover the changes probable in the conditions shown on the chart. Some of the leading principles that are applied have been explained in previous chapters.
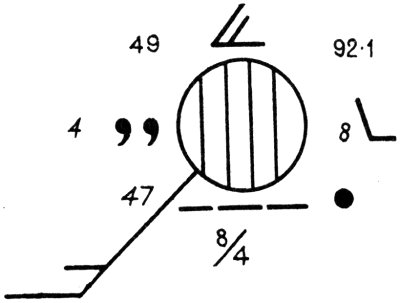
FIG. 22. WEATHER OBSERVATIONS AS PLOTTED FOR A LAND STATION.
The scheme of plotting the observations on the chart is illustrated in Fig. 22. It is usual to write certain of them in red ink, the rest in black, to facilitate rapid reading. The large circle, already printed on the chart, marks the station. The vertical lines in it denote the state of the sky, the four lines in this case denoting a completely overcast sky. The kind of lower cloud is shown immediately below the station circle, the three horizontal strokes indicating stratus. The middle clouds are shown immediately above the circle, in this case thick alto-stratus; the highest clouds, if any, would be shown above. The figures 8/4 are the code figures which give the amount and height of the low cloud; they indicate that the low cloud amount is 10/10 of the sky covered, the base being between 1,000 ft. and 2,000 ft. above the ground. The wind arrow carries feathers denoting the force of the wind on the Beaufort scale, a long feather meaning 2 units and a short feather 1 on that scale (see p. 36). Temperatures in °F. are shown by the upper 91 (dry bulb) and the lower (dew-point) figures on the left of the station circle, and the figure between is the code number for the visibility, 4 denoting a visibility of between half and one mile. The upper figure on the right, 92.1, is a shortened form of 992.1, and is the corrected barometer reading in mb.; the figure below it, in this case 8, gives the change in the barometer in the preceding three hours, expressed in tenths of a millibar, and the sign on its right shows the ‘characteristic’ or form of the barograph trace in the same time. The weather at the time of observation is shown by symbols to the left of the middle of the station circle, the two ‘commas’ indicating continuous slight drizzle; and the weather in the last three hours in the bottom right of the plot, the large dot meaning rain.
The data at a large number of stations can be included if the plotting is done neatly. Observations in ships are plotted in a similar way in their correct positions. The meteorologist is thus provided with a fairly full picture of a large area, and is able to give a description of the weather in any part required. In addition to the surface observations he has usually received information from at least two or three stations about the winds, and sometimes the temperatures, in the upper air.
But in order to obtain an intelligent grasp of even the existing conditions, and still more in order to forecast likely changes, it is necessary to insert on the chart from the plotted observations the isobars, to show the pressure systems present, and the fronts to show the boundaries of the air masses and their interactions. The various fronts are shown by lines of different colours, and areas of precipitation or fog are also coloured suitably. (For reproduction in black the fronts are shown by lines of different type as in Figs. 19-21.) The synoptic chart thus prepared is the basis of the meteorologist’s work. A serious drawback for forecasting is the length of time, 92 about three hours, that elapses between the taking of the observations and the completion of the chart.
The forecaster first decides what pressure system or systems are controlling the weather at the time, and are likely to do so in the period for which the forecast is made. Next to be considered are the movements of the systems, and the changes going on in them, including the movements of air masses and the fronts between them. The shorter the period of the forecast the less the change, and the fewer the unexpected developments are likely to be. But a forecast for only a few hours ahead may prove inaccurate, and a frequent cause is an unexpected change in the movement of a front. This is one reason why it is desirable that pilots should understand the principles used. They may then be able to recognize in what way a forecast is proving faulty, owing, for example, to a front coming up more rapidly or less rapidly than was expected, and interpret the situation accordingly. They can always see the latest reports and charts, and have the basis of the forecast explained, at the meteorological office of the aerodrome. Sometimes, however, changes of large magnitude may take place in the pressure systems or their movements. They may unexpectedly deepen or fill up, be retarded or accelerated, with production of weather quite different from that forecast. Sometimes a small change in the track followed by a depression may have serious results. As an example of this, suppose a depression over the Atlantic in winter to be advancing eastward, apparently so as to pass north of England. The presumption is that the precipitation over England will be in the form of rain. But if the depression follows a track more to the south, so as to pass up the Channel, there will probably be heavy snow over much of the country, a difference of great significance for flying as well as for other forms of transport. A close watch on the reports from observing stations may give the forecaster warning of 93 such changes, and he will then see how his forecast should be modified, but it will probably be impossible to publish any announcement before the time of his next forecast.
In addition to conforming to the more ordinary and tractable physical principles which govern weather, experience shows that the atmosphere in a region may acquire a weather ‘mood’, that is to say, a strong tendency to persist in a certain type. The type may be anticyclonic, or it may be cyclonic. If cyclonic the depressions tend to follow the same track again and again, and they may be more, or less, rain-bearing than their form would indicate, and other characteristics also may persist. The mood is itself merely the expression of physical conditions, but these are difficult to identify, owing, perhaps, to their widespread operation, for they may be acting gently over a very extensive area, a much less visible condition than, for example, the vigorous, because localized, manifestations in a front. The sooner the mood is recognized and due allowance made for it the more successful will the forecasts be.
Weather was a matter of practical concern to many people long before modern meteorology with its synoptic charts was thought of. The sailor and the farmer had to base their forecasts entirely on the appearance of the sky and the atmospheric elements within their perception. Probably long experience acquired in an out-of-doors life made them more acute observers than most city dwellers of to-day, and long practice gave their empirical efforts considerable success. But a little reflection shows how much more extensive is the outlook of the meteorologist with a synoptic chart which gives him a view of the salient features of air and sky over a quarter of a hemisphere. True his principles, based on both experience and science, only too often fail him. As long as the atmosphere continues in its state of repose or change his forecast is likely to be correct, but it may 94 suddenly alter its state without giving any long warning that can be perceived. The empirical chartless forecaster is in still worse plight, for his outlook is so limited that the change may be upon him without any warning. His surmises are correct only so long as the signs in the sky on which he relies are followed by their normal weather sequence; any change from the normal is beyond his ken. The limitation of his outlook to 20 or 30 miles puts him at a great disadvantage.
A combination of the two methods offers the best prospect of success. The meteorologist must have the most detailed and widespread information, plotted on synoptic charts. And he should work in as open a situation as possible, in the country far from towns with their industrial haze and other artificial conditions, so that he may become thoroughly familiar with the face of the real sky, and be able to read its signs. It is an additional advantage to work well on the weather side of the area for which he is forecasting, so that he may get the earliest warning of events. He can thus make use of the wide range of information put at his disposal by organization and wireless, and of such local signs as have proved their value, and he will be able to issue his forecasts at the earliest possible time. But it is clear that until we can at least explain fully the weather of yesterday, of which we are in possession of all the facts, it is too much to expect certainty of success in forecasting the weather of to-morrow.
A B C D E F G H I J K L M N O P Q R S T U V W X Y Z
With aviation’s coming of age, weather has taken on a new importance and its interest for the layman has increased. While primarily designed for the student pilot, to whom a knowledge of the composition of weather is a basic requirement, this book, written by one of the foremost meteorological authorities in the world, is for everyone interested in this fascinating subject. Today more than ever before a knowledge of what weather means is of concern to everyone whose livelihood or welfare depends upon it: the farmer, the fisherman, the hunter, the men engaged in shipping by railroad, truck, ship or plane. Since weather bureaus are not permitted in wartime to forecast beyond a few hours, it is of importance that those to whom weather is an imperative matter should know enough of its composition to take advantage of its benefits and to ward against its disasters. That Mr. Kendrew can in Weather describe such a complicated subject simply in non-technical terms is indeed a triumph. Clear concise chapters cover: Atmosphere; Temperature; Water Vapour in the Atmosphere; Barometric Pressure; Winds; Vertical Movements of the Atmosphere; Temperature Changes in Air due to Ascent and Descent; Turbulence; Clouds; Visibility Pressure Systems in the Westerlies; Air Masses; Structures of Depressions; Fronts; Movements of Depressions and Fronts; Anticyclones; The Synoptic Chart; Forecasting. The text is made even more lucid by the inclusion of 22 explanatory charts.
Mr. Kendrew is the author of the standard works Climate ($4.25) and The Climates of the Continents ($7.00).
$1.00 Illustrated
CLIMATE: A Treatise on the Principle of Weather and Climate
By W. G. Kendrew
Second Edition 1938
Pp. 340, with 117 illustrations and 12 plates
$4.25
THE CLIMATES OF THE CONTINENTS
By W. G. Kendrew
Third Edition 1942
Pp. 486, With 160 illustrations
$7.00
CLIMATE AND THE ENERGY OF NATIONS
By S. F. Markham
1942
Pp. 144, with 17 illustrations
★
OXFORD UNIVERSITY PRESS
LONDON NEW YORK TORONTO
[The end of Weather, An Introductory Meteorology by Wilfrid George Kendrew]